
Medicare Part D is a voluntary outpatient prescription drug benefit for people on Medicare that went into effect in 2006. All 59 million people on Medicare, including those ages 65 and older and those under age 65 with permanent disabilities, have access to the Part D drug benefit through private plans approved by the federal government; in 2017, more than 42 million Medicare beneficiaries are enrolled in Medicare Part D plans. During the Medicare Part D open enrollment period, which runs from October 15 to December 7 each year, beneficiaries can choose to enroll in either stand-alone prescription drug plans (PDPs) to supplement traditional Medicare or Medicare Advantage prescription drug (MA-PD) plans (mainly HMOs and PPOs) that cover all Medicare benefits including drugs. Beneficiaries with low incomes and modest assets are eligible for assistance with Part D plan premiums and cost sharing. This fact sheet provides an overview of the Medicare Part D program and information about 2018 plan offerings, based on data from the Centers for Medicare & Medicaid Services (CMS) and other sources.
Medicare Prescription Drug Plan Availability in 2018
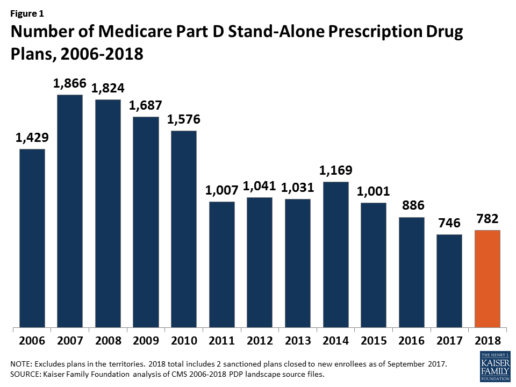
In 2018, 782 PDPs will be offered across the 34 PDP regions nationwide (excluding the territories). This represents an increase of 36 PDPs, or 5%, since 2017, but a reduction of 104 plans, or 12%, since 2016 (Figure 1).
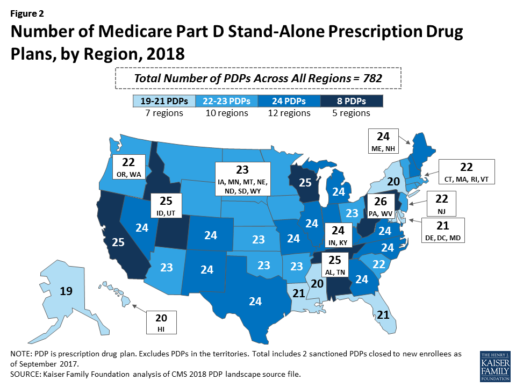
Beneficiaries in each state will continue to have a choice of multiple stand-alone PDPs in 2018, ranging from 19 PDPs in Alaska to 26 PDPs in Pennsylvania/West Virginia (in addition to multiple MA-PD plans offered at the local level) (Figure 2).
Low-Income Subsidy Plan Availability in 2018
Through the Part D Low-Income Subsidy (LIS) program, additional premium and cost-sharing assistance is available for Part D enrollees with low incomes (less than 150% of poverty, or $18,090 for individuals/$24,360 for married couples in 2017) and modest assets (less than $13,820 for individuals/$27,600 for couples in 2017).1
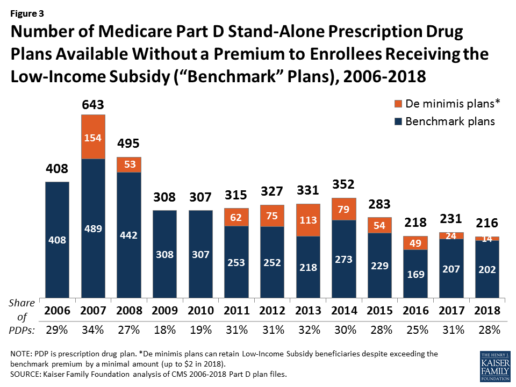
In 2018, 216 plans will be available for enrollment of LIS beneficiaries for no premium, a 6% decrease in premium-free (“benchmark”) plans from 2017 and the lowest number of benchmark plans available since the start of the Part D program in 2006. Roughly 3 in 10 PDPs in 2018 (28%) are benchmark plans (Figure 3).
Low-Income Subsidy Plan Availability in 2018
Through the Part D Low-Income Subsidy (LIS) program, additional premium and cost-sharing assistance is available for Part D enrollees with low incomes (less than 150% of poverty, or $18,090 for individuals/$24,360 for married couples in 2017) and modest assets (less than $13,820 for individuals/$27,600 for couples in 2017).1
In 2018, 216 plans will be available for enrollment of LIS beneficiaries for no premium, a 6% decrease in premium-free (“benchmark”) plans from 2017 and the lowest number of benchmark plans available since the start of the Part D program in 2006. Roughly 3 in 10 PDPs in 2018 (28%) are benchmark plans (Figure 3).
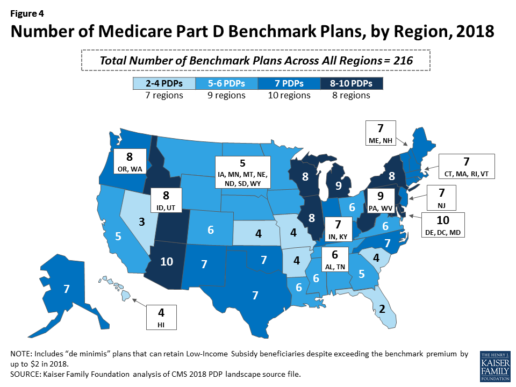
Benchmark plan availability varies at the Part D region level, with most regions seeing a reduction of 1 benchmark plan for 2018 (Figure 4). The number of premium-free plans in 2018 ranges from a low of 2 plans in Florida to 10 plans in Arizona and Delaware/Maryland/Washington D.C.
Part D Plan Premiums and Benefits in 2018
Premiums. According to CMS, the 2018 Part D base beneficiary premium is $35.02, a modest decline of 2% from 2017.2 Actual (unweighted) PDP monthly premiums for 2018 vary across plans and regions, ranging from a low of $12.60 for a PDP available in 12 out of 34 regions to a high of $197 for a PDP in Texas.
Part D enrollees with higher incomes ($85,000/individual; $170,000/couple) pay an income-related monthly premium surcharge, ranging from $13.00 to $74.80 in 2018 (depending on their income level), in addition to the monthly premium for their specific plan.3 According to CMS projections, an estimated 3.3 million Part D enrollees (7%) will pay income-related Part D premiums in 2018.
Benefits. In 2018, the Part D standard benefit has a $405 deductible and 25% coinsurance up to an initial coverage limit of $3,750 in total drug costs, followed by a coverage gap. During the gap, enrollees are responsible for a larger share of their total drug costs than in the initial coverage period, until their total out-of-pocket spending in 2018 reaches $5,000 (Figure 5).
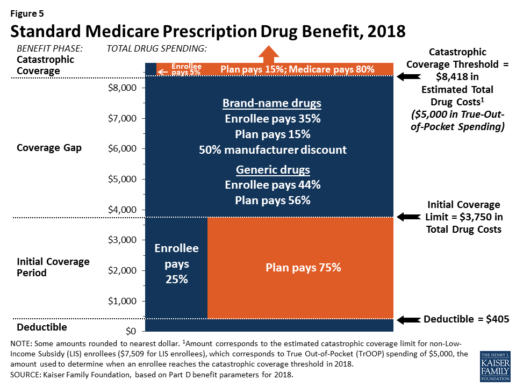
After enrollees reach the catastrophic coverage threshold, Medicare pays for most (80%) of their drug costs, plans pay 15%, and enrollees pay either 5% of total drug costs or $3.35/$8.35 for each generic and brand-name drug, respectively.
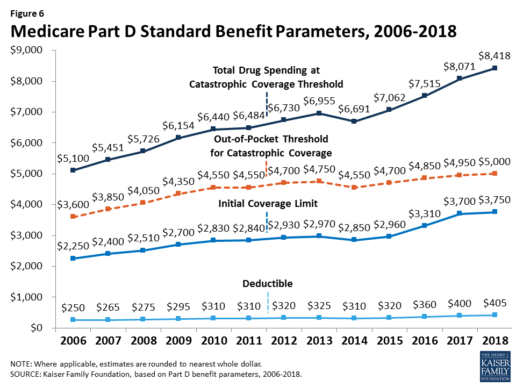
The standard benefit amounts are indexed to change annually by rate of Part D per capita spending growth, and, with the exception of 2014, have increased each year since 2006 (Figure 6).
Part D plans must offer either the defined standard benefit or an alternative equal in value (“actuarially equivalent”), and can also provide enhanced benefits. But plans can (and do) vary in terms of their specific benefit design, cost-sharing amounts, utilization management tools (i.e., prior authorization, quantity limits, and step therapy), and formularies (i.e., covered drugs). Plan formularies must include drug classes covering all disease states, and a minimum of two chemically distinct drugs in each class. Part D plans are required to cover all drugs in six so-called “protected” classes: immunosuppressants, antidepressants, antipsychotics, anticonvulsants, antiretrovirals, and antineoplastics.
In 2018, almost half (46%) of plans will offer basic Part D benefits (although no plans will offer the defined standard benefit), while 54% will offer enhanced benefits, similar to 2017. Most PDPs (63%) will charge a deductible, with 52% of all PDPs charging the full amount ($405). Most plans have shifted to charging tiered copayments or varying coinsurance amounts for covered drugs rather than a uniform 25% coinsurance rate, and a substantial majority of PDPs use specialty tiers for high-cost medications. Two-thirds of PDPs (65%) will not offer additional gap coverage in 2018 beyond what is required under the standard benefit. Additional gap coverage, when offered, has been typically limited to generic drugs only (not brands).
The 2010 Affordable Care Act gradually lowers out-of-pocket costs in the coverage gap by providing enrollees with a 50% manufacturer discount on the total cost of their brand-name drugs filled in the gap and additional plan payments for brands and generics. In 2018, Part D enrollees in plans with no additional gap coverage will pay 35% of the total cost of brands and 44% of the total cost of generics in the gap until they reach the catastrophic coverage threshold. Medicare will phase in additional subsidies for brands and generic drugs, ultimately reducing the beneficiary coinsurance rate in the gap to 25% by 2020.
Part D and Low-Income Subsidy Enrollment
Enrollment in Medicare drug plans is voluntary, with the exception of beneficiaries who are dually eligible for both Medicare and Medicaid and certain other low-income beneficiaries who are automatically enrolled in a PDP if they do not choose a plan on their own. Unless beneficiaries have drug coverage from another source that is at least as good as standard Part D coverage (“creditable coverage”), they face a penalty equal to 1% of the national average premium for each month they delay enrollment.
In 2017, more than 42 million Medicare beneficiaries are enrolled in Medicare Part D plans, including employer-only group plans.4 Of this total, 6 in 10 (60%) are enrolled in stand-alone PDPs and 4 in 10 (40%) are enrolled in Medicare Advantage drug plans. Medicare’s actuaries estimate that around 2 million other beneficiaries in 2017 have drug coverage through employer-sponsored retiree plans where the employer receives subsidies equal to 28% of drug expenses between $405 and $8,350 per retiree in 2018 (up from $400 and $8,250 in 2017).5 Several million beneficiaries are estimated to have other sources of drug coverage, including employer plans for active workers, FEHBP, TRICARE, and Veterans Affairs (VA). Yet an estimated 12% of Medicare beneficiaries lack creditable drug coverage.
Twelve million Part D enrollees are currently receiving the Low-Income Subsidy. Beneficiaries who are dually eligible, QMBs, SLMBs, QIs, and SSI-onlys automatically qualify for the additional assistance, and Medicare automatically enrolls them into PDPs with premiums at or below the regional average (the Low-Income Subsidy benchmark) if they do not choose a plan on their own. Other beneficiaries are subject to both an income and asset test and need to apply for the Low-Income Subsidy through either the Social Security Administration or Medicaid.
Part D Spending and Financing in 2018
The Congressional Budget Office (CBO) estimates that spending on Part D benefits will total $92 billion in 2018, representing 15.5% of net Medicare outlays in 2018 (net of offsetting receipts from premiums and state transfers). Part D spending depends on several factors, including the number of Part D enrollees, their health status and drug use, the number of enrollees receiving the Low-Income Subsidy, and plans’ ability to negotiate discounts (rebates) with drug companies and preferred pricing arrangements with pharmacies, and manage use (e.g., promoting use of generic drugs, prior authorization, step therapy, quantity limits, and mail order). Federal law prohibits the Secretary of Health and Human Services from interfering in drug price negotiations between Part D plan sponsors and drug manufacturers.6
Financing for Part D comes from general revenues (78%), beneficiary premiums (13%), and state contributions (9%). The monthly premium paid by enrollees is set to cover 25.5% of the cost of standard drug coverage. Medicare subsidizes the remaining 74.5%, based on bids submitted by plans for their expected benefit payments. Part D enrollees with higher incomes ($85,000/individual; $170,000/couple) pay a greater share of standard Part D costs, ranging from 35% to 80%, depending on income.
According to Medicare’s actuaries, in 2018, Part D plans are projected to receive average annual direct subsidy payments of $353 per enrollee overall and $2,353 for enrollees receiving the LIS; employers are expected to receive, on average, $623 for retirees in employer-subsidy plans.7 Part D plans’ potential total losses or gains are limited by risk-sharing arrangements with the federal government (“risk corridors”). Plans also receive additional risk-adjusted payments based on the health status of their enrollees and reinsurance payments for very high-cost enrollees.
Under reinsurance, Medicare subsidizes 80% of drug spending incurred by Part D enrollees above the catastrophic coverage threshold. In 2018, average reinsurance payments per enrollee are estimated to be $941; this represents a 7% increase from 2017. Medicare’s reinsurance payments to plans have represented a growing share of total Part D spending, increasing from 16% in 2007 to an estimated 41% in 2018.8 This is due in part to a growing number of Part D enrollees with spending above the catastrophic threshold, resulting from several factors, including the introduction of high-cost specialty drugs, increases in the cost of prescriptions, and a change made by the ACA to count the 50% manufacturer discount in enrollees’ out-of-pocket spending that qualifies them for catastrophic coverage. Analysis from MedPAC also suggests that in recent years, plans have underestimated their enrollees’ expected costs above the catastrophic coverage threshold, resulting in higher reinsurance payments from Medicare to plans over time.
Issues for the Future
After several years of relatively low growth in prescription drug spending, spending has risen more steeply since 2013. The average annual rate of growth in Part D costs per beneficiary was 2.4% between 2007 and 2013, but it increased to 4.4% between 2013 and 2016, and is projected to increase by 4.7% between 2016 and 2026
(Figure 7).9
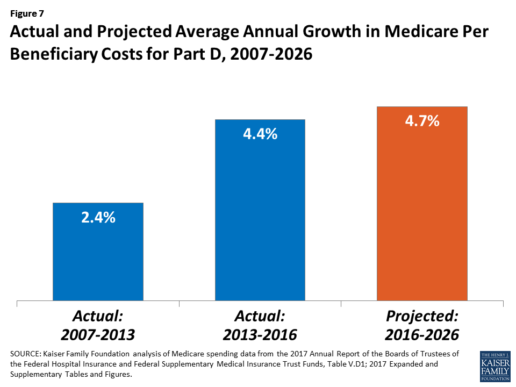
Medicare’s actuaries have projected that the Part D per capita growth rate will be comparatively higher in the coming years than in the program’s initial years due to higher costs associated with expensive specialty drugs, which is expected to be reflected in higher reinsurance payments to plans. Between 2017 and 2027, spending on Part D benefits is projected to increase from 15.9% to 17.5% of total Medicare spending (net of offsetting receipts).10 Understanding whether and to what extent private plans are able to negotiate price discounts and rebates will be an important part of ongoing efforts to assess how well plans are able to contain rising drug costs. However, drug-specific rebate information is not disclosed by CMS.
The Medicare drug benefit helps to reduce out-of-pocket drug spending for enrollees, which is especially important to those with modest incomes or very high drug costs. Closing the coverage gap by 2020 will bring additional relief to millions of enrollees with high costs. But with drug spending on the rise and more plans charging coinsurance rather than flat copayments for covered brand-name drugs, enrollees could face higher out-of-pocket costs for their Part D coverage. These trends highlight the importance of comparing plans during the annual enrollment period. Research shows, however, that relatively few people on Medicare have used the annual opportunity to switch Part D plans voluntarily—even though those who do switch often lower their out-of-pocket costs as a result of changing plans.
Understanding how well Part D is working and how well it is meeting the needs of people on Medicare will be informed by ongoing monitoring of the Part D plan marketplace and plan enrollment; assessing coverage and costs for high-cost biologics and other specialty drugs; exploring the relationship between Part D spending and spending on other Medicare-covered services; and evaluating the impact of the drug benefit on Medicare beneficiaries’ out-of-pocket spending and health outcomes.
Endnotes
- Poverty and resource levels for 2018 are not yet available (as of September 2017).
- The base beneficiary premium is equal to the product of the beneficiary premium percentage and the national average monthly bid amount (which is an enrollment-weighted average of bids submitted by both PDPs and MA-PD plans). Centers for Medicare & Medicaid Services, “Annual Release of Part D National Average Bid Amount and Other Part C & D Bid Information,” July 31, 2017, available at https://www.cms.gov/Medicare/Health-Plans/MedicareAdvtgSpecRateStats/Downloads/PartDandMABenchmarks2018.pdf.
- Higher-income Part D enrollees also pay higher monthly Part B premiums.
- Centers for Medicare & Medicaid Services, Medicare Advantage, Cost, PACE, Demo, and Prescription Drug Plan Contract Report – Monthly Summary Report (Data as of August 2017).
- Board of Trustees, 2017 Annual Report of the Boards of Trustees of the Federal Hospital Insurance and Federal Supplementary Medical Insurance Trust Funds, Table IV.B7, available at https://www.cms.gov/Research-Statistics-Data-and-Systems/Statistics-Trends-and-Reports/ReportsTrustFunds/Downloads/TR2017.pdf.
- Social Security Act, Section 1860D-11(i).
- 2017 Annual Report of the Boards of Trustees of the Federal Hospital Insurance and Federal Supplementary Medical Insurance Trust Funds; Table IV.B9.
- Kaiser Family Foundation analysis of aggregate Part D reimbursement amounts from Table IV.B10, 2017 Annual Report of the Boards of Trustees of the Federal Hospital Insurance and Federal Supplementary Medical Insurance Trust Funds.
- Kaiser Family Foundation analysis of Part D average per beneficiary costs from Table V.D1, 2017 Annual Report of the Boards of Trustees of the Federal Hospital Insurance and Federal Supplementary Medical Insurance Trust Funds.
- Kaiser Family Foundation analysis of Part D benefits spending as a share of net Medicare outlays (total mandatory and discretionary outlays minus offsetting receipts) from CBO, Medicare-Congressional Budget Office’s June 2017 Baseline.
Read the full article here.
Source:
Kaiser Family Foundation (2 October 2017). “The Medicare Part D Prescription Drug Benefit” [Web Blog Post]. Retrieved from address https://www.kff.org/medicare/fact-sheet/the-medicare-prescription-drug-benefit-fact-sheet/#26740