

I Have Life Insurance Through My Employer. Why Do I Need Another Policy?
Life Happens in a Heartbeat - Stay Prepared With Saxon Life Insurance.
Although it is a subject no one wants to talk about, Life Insurance may be one of the best purchases you ever make.
Have you considered what would happen if you were not there to take care of your loved ones? Life insurance plans are about preparing for the unexpected. While nothing can replace you, having Life Insurance helps ensure that your family and loved ones would be financially stable if anything was to ever happen to you. Check out this article from Life Happens on the importance of obtaining Life Insurance - even if it's already offered through your employer.
One of the perks of having a full-time job with a good company is the benefits package that comes with it. Often, those benefits include life insurance coverage, which is great. And everyone who can get life insurance at work should definitely take it, as there are many advantages to company-funded life insurance, also known as group life insurance. These advantages include:
1. Easy qualification. Often, enrollment into group life insurance is automatic. That means everyone qualifies, as there is no medical exam required. So people who have preexisting health conditions, like diabetes or previous heart attack, can get life insurance at work, and may get a better rate compared with what an individual life insurance policy might cost them.
2. Lower costs. Employers’ insurance plans tend to be paid for or subsidized by the company, giving you life insurance at a low cost or even free. You may even have the option to buy additional coverage at low rates. Costs tend to be lower for many people because with group plans, the cost per individual goes down as the plan enlarges.
3. Convenience. It’s easy to subscribe to an employer’s life insurance plan without much effort on your part and if a payment is required, it’s easily deducted from your paycheck in much the same way as your medical costs are deducted.
These are all great advantages, but are these the only considerations that matter when it comes to life insurance? The answer, of course, is no.
Life insurance should first and foremost fit the purpose—it should meet your needs.
Life insurance should first and foremost fit the purpose—it should meet your needs. And the primary purpose of life insurance is to care for those left behind in the event of your death. With group life insurance, it’s often set at one or two times your annual salary, or a default amount such as $25,000 or $50,000. While this sounds like a lot of money, just think of how long that would last your loved ones. What would they do once that ran out?
There are several other disadvantages to relying on group insurance alone:
1. If your job situation changes, you’ll lose your coverage. Whether the change results from being laid off, moving from full-time to part-time status or leaving the job, in most cases, an employee can’t retain their policy when they leave their job.
2. Coverage may end when you retire or reach a specific age. Many people tend to lose their insurance coverage when they continue working past a specified age or when they retire. This means losing your insurance when you need it most.
3. Your employer can change or terminate the coverage. And that can be without your consent, since the contract is between your employer and the insurer.
4. Your options are limited. This type of coverage is not tailored to your specific needs. Furthermore, you may not be able to buy as much coverage as you need, leaving you exposed.
Importance of Buying a Separate Life Insurance Policy
It’s for these reasons you should get an individual life insurance policy that you personally own, in addition to any group life insurance you have. Individual life insurance plans offer superior benefits, and regardless of your employer or employment status, they remain in place and can be tailored to meet your needs and circumstances.
Most importantly, an individual life insurance policy will fit the purpose for which you purchase it—to ensure your dependents continue to have the financial means to keep their home and lifestyle in the unfortunate event that you’re no longer there to care for them.
Don't wait to protect your livelihood. Set up an appointment with one of our life insurance specialists here at Saxon by clicking this link.
Source:
Medina F. (19 June 2017). "I Have Life Insurance Through My Employer. Why Do I Need Another Policy?" [Web blog post]. Retrieved from address https://www.lifehappens.org/blog/i-have-life-insurance-through-my-employer-why-do-i-need-another-policy/

CenterStage: Fee-Based vs Commission-Based Advisors: What You Should Know
 “After almost 30 years of working in the business, the most important question to ask,” Garry Rutledge, AIF®, a Fee Based Advisor with Saxon, explained, “is do you trust that person to make decisions in your best interest or in theirs?”
In this month’s CenterStage article, we sat down with Garry to get the lowdown on what to expect from both fee-based financial advisors and commission-based advisors.
When Is a Commission-Based Advisor a Better Choice than a Fee-Based Advisor?
A commission-based advisor receives compensation for transactional business, usually at the point of sale, with a small annual fee to encourage advisor engagement. A client rarely knows the commission amount until the transaction is completed.
Garry mentioned, “those who purchase investments for the long term are better off choosing a commission-based advisor, who won’t pursue the client for information and bombard you with advice.”
Also, if you are a do-it-yourselfer when it comes to investing, a commission-based advisor is a great fit for you.
When Is a Fee-Based Advisor a Better Choice than a Commission-Based Advisor?
A fee-based advisor tends to value relationship’s over transactions. This results in, typically, a more involved and hands on process, because positive results increase the value of client’s portfolio. A fee-based advisor takes a consultative approach to managing client’s assets and is more likely to offer a broader scope of advice than compared to a commission based advisor.
A fee-based advisor works for the relationship resulting in little or no bias to an investment or its sponsor, as it relates to compensation, vs a commission-based advisor who may consider the compensation when making a decision when weighing similar products.
What Are You Paying Your Financial Advisor?
There are three means of advisor compensation:
- Commission for products or transactions
- A percentage of assets an advisor manages
- A hybrid between method 1 and 2
It’s imperative to know which method your advisor utilizes. This knowledge allows you to determine if you are receiving advice commensurate with the value provided. A Commissioned advisor, after making a sale, generally has no interest in what the outcome is because they have received compensation vs a fee based advisor who must build trust with clients to maintain a meaningful relationship.
Garry very rarely utilizes the hybrid model when working with clients. However, in keeping with his philosophy of doing right by his clients, there are times when he must employ this model. Garry points out, “at times, an alternative investment that is a complimentary piece of a client’s portfolio is not available on a fee basis, in which circumstance dictates that I receive a commission. In full disclosure, my clients realize when this happens and exactly what their charge will be.”
As a means of building relationships, Garry has and is focused on sustaining the fee based practice he has built and continues to build through client referrals. Garry’s fees range from 1% to .5%, depending on the assets and complexity of a client case. With this knowledge, clients know what their expenses will be up front.
The length of his client relationships is a testament that fee based advising is successful in building a solid financial advisory firm.
In the end, the client must determine what works for them, as far as how they will compensate the advisor. If a client wants to be transactional, commission is the way to proceed; but if an ongoing relationship is a requirement, a fee-based advisor is the best path for them.
More About Garry
Garry joined Saxon in August of 2006 and his focus has been the strategic management of client assets with tax minimization and capital preservation as the foundation of his planning strategy.
Since graduating from Wright State University in 1988 with a degree in Finance, Garry has worked for two respected firms. Garry holds Series 7 & 63 securities licenses, and his Life & Health license, along with achieving the professional AIF (Accredited Independent Fiduciary) designation.
You can contact Garry via email, phone, or connect with him on LinkedIn.
These are the opinions of Garry Rutledge and not necessarily those of Cambridge; they are for informal purposes only, and should not be construed or acted upon as individualized investment advice. All investing involves risk. Depending on the types of investments, there may be varying degrees of risk. Investors should be prepared to bear loss, including total loss of principal.
Download the PDF
SaveSave

Health Care Sector Earnings: Major Companies Open The Books On Q3 Results In Weeks Ahead

Photo Credit: Shutterstock
The health care sector has been one of the better-performing sectors in 2017, bouncing back after being the only sector in the S&P 500 to finish last year in the red. So far this year, the S&P Health Care Select Sector Index is outperforming the S&P 500 by 5.75% as of October 6.
The sector got a bump recently when Republicans’ released an initial framework for tax reform, with CNBC pointing out that some of the largest companies in the health care sector could be primary beneficiaries of the proposed repatriation tax break. For the sector’s upcoming earnings, analyst estimates are calling for low to mid-single-digit growth for both earnings and revenue.
Within the S&P 500, the health care sector is expected to report year-over-year revenue growth of 4.8% and earnings growth of 2.5%, according to FactSet, with profit margins estimated to decline from 10.3% to 10.1% across the sector. Those estimates are slightly below the sector’s estimated revenue and earnings growth rates expected for the full year.
Beyond the proposed tax reform, below we’ll take a look at what’s been happening in the sector as companies prepare to report earnings in the upcoming weeks.
 thinkorswim
After underperforming by a large margin in 2016, the health care sector has been recovering in 2017. The S&P Health Care Select Sector Index, charted above, is up 18.49% year-to-date, compared to a 12.74% increase in the S&P 500, the teal line. The Nasdaq Biotechnology Index, the purple line, has outperformed both and climbed 25.6% year-to-date. Chart source: thinkorswim® by TD Ameritrade. Data source: Standard & Poor’s. Not a recommendation. For illustrative purposes only. Past performance does not guarantee future results.
Biotech Industry Outperforming
So far this year, the biotechnology industry has outpaced the broader health care sector, with the Nasdaq Biotechnology Index up 25.6% versus a 18.49% increase in the S&P Health Care Select Sector Index. However, looking at 2016, the Nasdaq Biotechnology Index fared far worse than the S&P Health Care Select Sector Index, declining 22.01% when the latter only declined 4.37%.
Stocks in the biotech industry are notoriously volatile and it can take many years, even decades, for a company to undergo research and development, and the clinical trial process. A 2014 study by Tufts University’s Center for the Study of Drug Development found that only 11.8% of drugs that enter clinical trials end up being approved by the FDA.
Washington on Health Care
Drug pricing scrutiny has been an ongoing focus in Congress, but there’s yet to be concrete legislation pushed forward to address the issue. Dr. Scott Gottlieb, the head of the Food and Drug Administration (FDA), recently said high drug prices are a “public health concern” and in a post on the FDA’s official blog, outlined several steps the agency is taking to make the generic approval process for complex drugs easier.
On October 17, the Senate Health Committee is scheduled to hold a second hearing as part of its investigation into high drug prices. Representatives from drug company and pharmacy benefit managers—essentially middle men between pharmacies and drug companies—have been invited to speak before the panel. Depending on how that hearing goes, there could be heightened volatility in healthcare stocks.
Due to the costly process of developing drugs, companies often go to great lengths to protect patents. Those practices have also started to come into scrutiny in Congress as well. Allergan announced last month it had transferred the patent rights for its drug Restasis to the St. Regis Mohawk Indian Nation, which would license them back to Allergan in exchange for ongoing payments to the tribe.
The tribe’s sovereign immunity would potentially shield the drug from certain patent reviews. “Allergan has argued that the legal maneuver is aimed at removing administrative patent challenges through inter partes review by the U.S. Patent Trial and Appeal Board, and not challenges in federal court”, according to Reuters.Shortly after Allergan transferred the patent rights, U.S. Senator Claire McCaskill quickly announced she had drafted a bill to prevent tribal sovereign immunity from being used to block U.S. Patent and Trademark Office review of a patent in response to the move.
Aging Demographics and More Disease as Population Grows
There are some trends that analysts anticipate to be tailwinds for the sector for years to come. One of them is aging demographics and the other is growth of certain diseases. Approximately 10,000 baby boomers turn 65 every day, according to Pew Research, and that trend is expected to continue until 2030, when the last of the boomers reach retirement age and roughly 18% of the U.S. population is projected to be 65 and older.
As world populations grow and age, certain diseases are expected to have a greater prevalence than others and a large portion of health care spending is likely to go towards them. By 2020, Deloitte projects that 50% of global health care expenditures, about $4 trillion, will be spent on cardiovascular diseases, cancer and respiratory diseases.
These trends could be a tailwind for healthcare companies, but at the same time a lot could change in the regulatory environment as well as with the treatments available in the years ahead.
Looking Ahead to Earnings
The first major company in the sector to report earnings is Johnson & Johnson, which will release results before market open on Tuesday, October 17. The following companies report later in the month: Eli Lilly & Co. before market open on Tuesday, October 24, Gilead Sciences after market close on Thursday, October 26, Merck before market open on Friday, October 27 and Pfizer before market open on Tuesday, October 31.
You can read the original article here.
Source:
Kinahan J. (10 October 2017). "Health Care Sector Earnings: Major Companies Open The Books On Q3 Results In Weeks Ahead" [Web Blog Post]. Retrieved from address https://www.forbes.com/sites/jjkinahan/2017/10/10/health-care-sector-earnings-major-companies-open-the-books-on-q3-results-in-weeks-ahead/#417bef6a44bb

The Medicare Part D Prescription Drug Benefit
Below we have an article from the Kaiser Family Foundation providing detailed information and graphics on the benefit of the Medicare Prescription Drug Plan.
You can read the original article here.
Medicare Part D is a voluntary outpatient prescription drug benefit for people on Medicare that went into effect in 2006. All 59 million people on Medicare, including those ages 65 and older and those under age 65 with permanent disabilities, have access to the Part D drug benefit through private plans approved by the federal government; in 2017, more than 42 million Medicare beneficiaries are enrolled in Medicare Part D plans. During the Medicare Part D open enrollment period, which runs from October 15 to December 7 each year, beneficiaries can choose to enroll in either stand-alone prescription drug plans (PDPs) to supplement traditional Medicare or Medicare Advantage prescription drug (MA-PD) plans (mainly HMOs and PPOs) that cover all Medicare benefits including drugs. Beneficiaries with low incomes and modest assets are eligible for assistance with Part D plan premiums and cost sharing. This fact sheet provides an overview of the Medicare Part D program and information about 2018 plan offerings, based on data from the Centers for Medicare & Medicaid Services (CMS) and other sources.
Medicare Prescription Drug Plan Availability in 2018
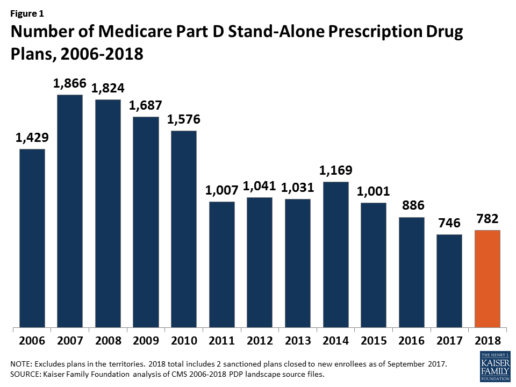
In 2018, 782 PDPs will be offered across the 34 PDP regions nationwide (excluding the territories). This represents an increase of 36 PDPs, or 5%, since 2017, but a reduction of 104 plans, or 12%, since 2016 (Figure 1).
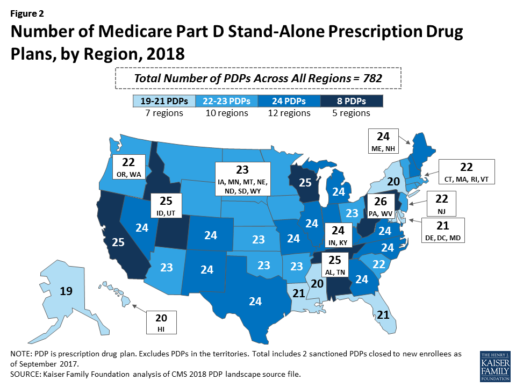
Beneficiaries in each state will continue to have a choice of multiple stand-alone PDPs in 2018, ranging from 19 PDPs in Alaska to 26 PDPs in Pennsylvania/West Virginia (in addition to multiple MA-PD plans offered at the local level) (Figure 2).
Low-Income Subsidy Plan Availability in 2018
Through the Part D Low-Income Subsidy (LIS) program, additional premium and cost-sharing assistance is available for Part D enrollees with low incomes (less than 150% of poverty, or $18,090 for individuals/$24,360 for married couples in 2017) and modest assets (less than $13,820 for individuals/$27,600 for couples in 2017).1
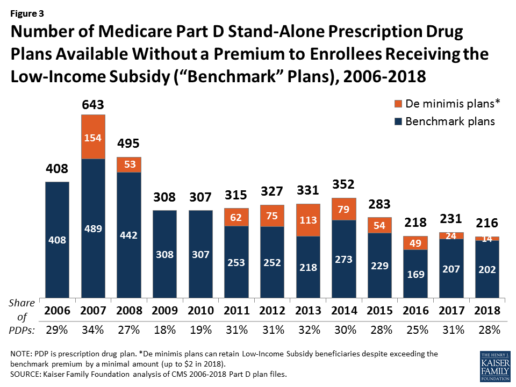
In 2018, 216 plans will be available for enrollment of LIS beneficiaries for no premium, a 6% decrease in premium-free (“benchmark”) plans from 2017 and the lowest number of benchmark plans available since the start of the Part D program in 2006. Roughly 3 in 10 PDPs in 2018 (28%) are benchmark plans (Figure 3).
Low-Income Subsidy Plan Availability in 2018
Through the Part D Low-Income Subsidy (LIS) program, additional premium and cost-sharing assistance is available for Part D enrollees with low incomes (less than 150% of poverty, or $18,090 for individuals/$24,360 for married couples in 2017) and modest assets (less than $13,820 for individuals/$27,600 for couples in 2017).1
In 2018, 216 plans will be available for enrollment of LIS beneficiaries for no premium, a 6% decrease in premium-free (“benchmark”) plans from 2017 and the lowest number of benchmark plans available since the start of the Part D program in 2006. Roughly 3 in 10 PDPs in 2018 (28%) are benchmark plans (Figure 3).
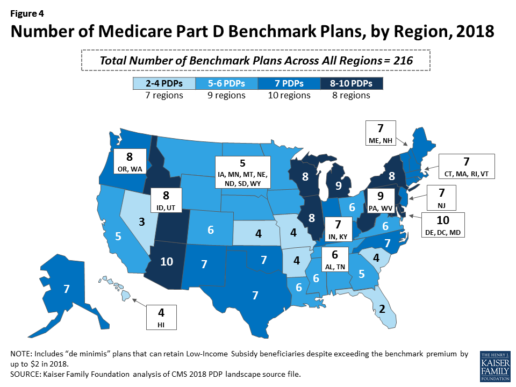
Benchmark plan availability varies at the Part D region level, with most regions seeing a reduction of 1 benchmark plan for 2018 (Figure 4). The number of premium-free plans in 2018 ranges from a low of 2 plans in Florida to 10 plans in Arizona and Delaware/Maryland/Washington D.C.
Part D Plan Premiums and Benefits in 2018
Premiums. According to CMS, the 2018 Part D base beneficiary premium is $35.02, a modest decline of 2% from 2017.2 Actual (unweighted) PDP monthly premiums for 2018 vary across plans and regions, ranging from a low of $12.60 for a PDP available in 12 out of 34 regions to a high of $197 for a PDP in Texas.
Part D enrollees with higher incomes ($85,000/individual; $170,000/couple) pay an income-related monthly premium surcharge, ranging from $13.00 to $74.80 in 2018 (depending on their income level), in addition to the monthly premium for their specific plan.3 According to CMS projections, an estimated 3.3 million Part D enrollees (7%) will pay income-related Part D premiums in 2018.
Benefits. In 2018, the Part D standard benefit has a $405 deductible and 25% coinsurance up to an initial coverage limit of $3,750 in total drug costs, followed by a coverage gap. During the gap, enrollees are responsible for a larger share of their total drug costs than in the initial coverage period, until their total out-of-pocket spending in 2018 reaches $5,000 (Figure 5).
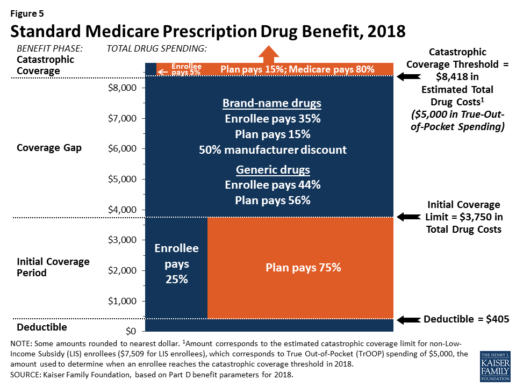
After enrollees reach the catastrophic coverage threshold, Medicare pays for most (80%) of their drug costs, plans pay 15%, and enrollees pay either 5% of total drug costs or $3.35/$8.35 for each generic and brand-name drug, respectively.
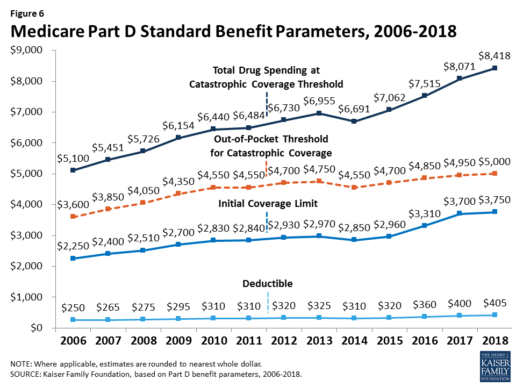
The standard benefit amounts are indexed to change annually by rate of Part D per capita spending growth, and, with the exception of 2014, have increased each year since 2006 (Figure 6).
Part D plans must offer either the defined standard benefit or an alternative equal in value (“actuarially equivalent”), and can also provide enhanced benefits. But plans can (and do) vary in terms of their specific benefit design, cost-sharing amounts, utilization management tools (i.e., prior authorization, quantity limits, and step therapy), and formularies (i.e., covered drugs). Plan formularies must include drug classes covering all disease states, and a minimum of two chemically distinct drugs in each class. Part D plans are required to cover all drugs in six so-called “protected” classes: immunosuppressants, antidepressants, antipsychotics, anticonvulsants, antiretrovirals, and antineoplastics.
In 2018, almost half (46%) of plans will offer basic Part D benefits (although no plans will offer the defined standard benefit), while 54% will offer enhanced benefits, similar to 2017. Most PDPs (63%) will charge a deductible, with 52% of all PDPs charging the full amount ($405). Most plans have shifted to charging tiered copayments or varying coinsurance amounts for covered drugs rather than a uniform 25% coinsurance rate, and a substantial majority of PDPs use specialty tiers for high-cost medications. Two-thirds of PDPs (65%) will not offer additional gap coverage in 2018 beyond what is required under the standard benefit. Additional gap coverage, when offered, has been typically limited to generic drugs only (not brands).
The 2010 Affordable Care Act gradually lowers out-of-pocket costs in the coverage gap by providing enrollees with a 50% manufacturer discount on the total cost of their brand-name drugs filled in the gap and additional plan payments for brands and generics. In 2018, Part D enrollees in plans with no additional gap coverage will pay 35% of the total cost of brands and 44% of the total cost of generics in the gap until they reach the catastrophic coverage threshold. Medicare will phase in additional subsidies for brands and generic drugs, ultimately reducing the beneficiary coinsurance rate in the gap to 25% by 2020.
Part D and Low-Income Subsidy Enrollment
Enrollment in Medicare drug plans is voluntary, with the exception of beneficiaries who are dually eligible for both Medicare and Medicaid and certain other low-income beneficiaries who are automatically enrolled in a PDP if they do not choose a plan on their own. Unless beneficiaries have drug coverage from another source that is at least as good as standard Part D coverage (“creditable coverage”), they face a penalty equal to 1% of the national average premium for each month they delay enrollment.
In 2017, more than 42 million Medicare beneficiaries are enrolled in Medicare Part D plans, including employer-only group plans.4 Of this total, 6 in 10 (60%) are enrolled in stand-alone PDPs and 4 in 10 (40%) are enrolled in Medicare Advantage drug plans. Medicare’s actuaries estimate that around 2 million other beneficiaries in 2017 have drug coverage through employer-sponsored retiree plans where the employer receives subsidies equal to 28% of drug expenses between $405 and $8,350 per retiree in 2018 (up from $400 and $8,250 in 2017).5 Several million beneficiaries are estimated to have other sources of drug coverage, including employer plans for active workers, FEHBP, TRICARE, and Veterans Affairs (VA). Yet an estimated 12% of Medicare beneficiaries lack creditable drug coverage.
Twelve million Part D enrollees are currently receiving the Low-Income Subsidy. Beneficiaries who are dually eligible, QMBs, SLMBs, QIs, and SSI-onlys automatically qualify for the additional assistance, and Medicare automatically enrolls them into PDPs with premiums at or below the regional average (the Low-Income Subsidy benchmark) if they do not choose a plan on their own. Other beneficiaries are subject to both an income and asset test and need to apply for the Low-Income Subsidy through either the Social Security Administration or Medicaid.
Part D Spending and Financing in 2018
The Congressional Budget Office (CBO) estimates that spending on Part D benefits will total $92 billion in 2018, representing 15.5% of net Medicare outlays in 2018 (net of offsetting receipts from premiums and state transfers). Part D spending depends on several factors, including the number of Part D enrollees, their health status and drug use, the number of enrollees receiving the Low-Income Subsidy, and plans’ ability to negotiate discounts (rebates) with drug companies and preferred pricing arrangements with pharmacies, and manage use (e.g., promoting use of generic drugs, prior authorization, step therapy, quantity limits, and mail order). Federal law prohibits the Secretary of Health and Human Services from interfering in drug price negotiations between Part D plan sponsors and drug manufacturers.6
Financing for Part D comes from general revenues (78%), beneficiary premiums (13%), and state contributions (9%). The monthly premium paid by enrollees is set to cover 25.5% of the cost of standard drug coverage. Medicare subsidizes the remaining 74.5%, based on bids submitted by plans for their expected benefit payments. Part D enrollees with higher incomes ($85,000/individual; $170,000/couple) pay a greater share of standard Part D costs, ranging from 35% to 80%, depending on income.
According to Medicare’s actuaries, in 2018, Part D plans are projected to receive average annual direct subsidy payments of $353 per enrollee overall and $2,353 for enrollees receiving the LIS; employers are expected to receive, on average, $623 for retirees in employer-subsidy plans.7 Part D plans’ potential total losses or gains are limited by risk-sharing arrangements with the federal government (“risk corridors”). Plans also receive additional risk-adjusted payments based on the health status of their enrollees and reinsurance payments for very high-cost enrollees.
Under reinsurance, Medicare subsidizes 80% of drug spending incurred by Part D enrollees above the catastrophic coverage threshold. In 2018, average reinsurance payments per enrollee are estimated to be $941; this represents a 7% increase from 2017. Medicare’s reinsurance payments to plans have represented a growing share of total Part D spending, increasing from 16% in 2007 to an estimated 41% in 2018.8 This is due in part to a growing number of Part D enrollees with spending above the catastrophic threshold, resulting from several factors, including the introduction of high-cost specialty drugs, increases in the cost of prescriptions, and a change made by the ACA to count the 50% manufacturer discount in enrollees’ out-of-pocket spending that qualifies them for catastrophic coverage. Analysis from MedPAC also suggests that in recent years, plans have underestimated their enrollees’ expected costs above the catastrophic coverage threshold, resulting in higher reinsurance payments from Medicare to plans over time.
Issues for the Future
After several years of relatively low growth in prescription drug spending, spending has risen more steeply since 2013. The average annual rate of growth in Part D costs per beneficiary was 2.4% between 2007 and 2013, but it increased to 4.4% between 2013 and 2016, and is projected to increase by 4.7% between 2016 and 2026
(Figure 7).9
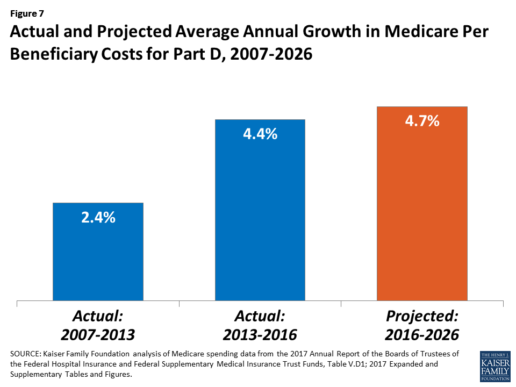
Medicare’s actuaries have projected that the Part D per capita growth rate will be comparatively higher in the coming years than in the program’s initial years due to higher costs associated with expensive specialty drugs, which is expected to be reflected in higher reinsurance payments to plans. Between 2017 and 2027, spending on Part D benefits is projected to increase from 15.9% to 17.5% of total Medicare spending (net of offsetting receipts).10 Understanding whether and to what extent private plans are able to negotiate price discounts and rebates will be an important part of ongoing efforts to assess how well plans are able to contain rising drug costs. However, drug-specific rebate information is not disclosed by CMS.
The Medicare drug benefit helps to reduce out-of-pocket drug spending for enrollees, which is especially important to those with modest incomes or very high drug costs. Closing the coverage gap by 2020 will bring additional relief to millions of enrollees with high costs. But with drug spending on the rise and more plans charging coinsurance rather than flat copayments for covered brand-name drugs, enrollees could face higher out-of-pocket costs for their Part D coverage. These trends highlight the importance of comparing plans during the annual enrollment period. Research shows, however, that relatively few people on Medicare have used the annual opportunity to switch Part D plans voluntarily—even though those who do switch often lower their out-of-pocket costs as a result of changing plans.
Understanding how well Part D is working and how well it is meeting the needs of people on Medicare will be informed by ongoing monitoring of the Part D plan marketplace and plan enrollment; assessing coverage and costs for high-cost biologics and other specialty drugs; exploring the relationship between Part D spending and spending on other Medicare-covered services; and evaluating the impact of the drug benefit on Medicare beneficiaries’ out-of-pocket spending and health outcomes.
Endnotes
- Poverty and resource levels for 2018 are not yet available (as of September 2017).
- The base beneficiary premium is equal to the product of the beneficiary premium percentage and the national average monthly bid amount (which is an enrollment-weighted average of bids submitted by both PDPs and MA-PD plans). Centers for Medicare & Medicaid Services, “Annual Release of Part D National Average Bid Amount and Other Part C & D Bid Information,” July 31, 2017, available at https://www.cms.gov/Medicare/Health-Plans/MedicareAdvtgSpecRateStats/Downloads/PartDandMABenchmarks2018.pdf.
- Higher-income Part D enrollees also pay higher monthly Part B premiums.
- Centers for Medicare & Medicaid Services, Medicare Advantage, Cost, PACE, Demo, and Prescription Drug Plan Contract Report – Monthly Summary Report (Data as of August 2017).
- Board of Trustees, 2017 Annual Report of the Boards of Trustees of the Federal Hospital Insurance and Federal Supplementary Medical Insurance Trust Funds, Table IV.B7, available at https://www.cms.gov/Research-Statistics-Data-and-Systems/Statistics-Trends-and-Reports/ReportsTrustFunds/Downloads/TR2017.pdf.
- Social Security Act, Section 1860D-11(i).
- 2017 Annual Report of the Boards of Trustees of the Federal Hospital Insurance and Federal Supplementary Medical Insurance Trust Funds; Table IV.B9.
- Kaiser Family Foundation analysis of aggregate Part D reimbursement amounts from Table IV.B10, 2017 Annual Report of the Boards of Trustees of the Federal Hospital Insurance and Federal Supplementary Medical Insurance Trust Funds.
- Kaiser Family Foundation analysis of Part D average per beneficiary costs from Table V.D1, 2017 Annual Report of the Boards of Trustees of the Federal Hospital Insurance and Federal Supplementary Medical Insurance Trust Funds.
- Kaiser Family Foundation analysis of Part D benefits spending as a share of net Medicare outlays (total mandatory and discretionary outlays minus offsetting receipts) from CBO, Medicare-Congressional Budget Office’s June 2017 Baseline.
Read the full article here.
Source:
Kaiser Family Foundation (2 October 2017). “The Medicare Part D Prescription Drug Benefit” [Web Blog Post]. Retrieved from address https://www.kff.org/medicare/fact-sheet/the-medicare-prescription-drug-benefit-fact-sheet/#26740

5 Benefits Communication Mistakes That Kill Employee Satisfaction
Are you using the proper communication channels to inform your employees about their benefits? Take a look at this great article from HR Morning about how to manage to communicate with your employees to keep them satisfied at work by Jared Bilski.
Good benefits communication is more important than the actual benefits you offer – at least when it comes to employee satisfaction.
Proof: When a company with a rich benefits program (i.e., better than industry standard) communicated poorly, just 22% of workers were satisfied with their benefits.
On the other hand, when an employer with a less rich benefits program communicated effectively, 76% of employees were satisfied with the benefits.
These findings come from a Towers Watson WorkUSA study.
At the at the 2017 Mid-Sized Retirement & Healthcare Plan Management Conference in Phoenix, AZ., Julie Adamik, the former head of Employee Benefits Training and Solutions at PETCO, highlighted the five most common benefits communication mistakes that put firms in the former category.
Satisfaction killers
1. The information is boring. Many employees assume that if the info is about benefits, it’s probably boring. As a result, they tend to tune out and miss critical material.
2. The learning styles and preferences of different generations aren’t taken into account. With multiple generations working side-by-side, a one-size-fits-all approach is doomed to fail.
3. The budget is too low. If your company has a $15 million benefits package, you shouldn’t accept upper management’s argument that a $2,500 communication budget should cover it. HR and benefits pros need to take a stand in this area.
4. The language is “too professional.” Assuming that official-sounding language is better than “plain speak” is a common but costly communication mistake.
5. There’s too much information being covered. Cramming everything into a single open enrollment meeting is guaranteed to overwhelm employees.
Cost, wellness, personal issues and care
Employers also need to be wary of relying too heavily on tech when it comes to benefits communication. Even though there are plenty of technological innovations in the world of benefits services and communications, but HR pros should never forget the importance of old-fashioned human interaction.
That’s one of the main takeaways from a recent Health Advocate study that was part of the whitepaper titled “Striking a Healthy Balance: What Employees Really Want Out of Workplace Benefits Communication.”
The study broke down employees’ preferred methods of benefits communications in a number of areas. (Note: Employees could select more than one answer.)
When asked how they preferred to receive health cost & administrative info, the report found:
- 73% of employees said directly with a person by phone
- 69% said via a website/online portal, and
- 56% preferred an in-person conversation.
Regarding their wellness benefits:
- 71% of employees preferred to receive the info through a website/online portal
- 62% said directly with a person by phone, and
- 56% preferred an in-person conversation.
In terms of personal/emotional wellness issues:
- 71% of employees preferred to receive the info directly with a person by phone
- 65% preferred an in-person conversation, and
- 60% would most like to receive the info via a website/online portal.
Finally, when it came to managing chronic conditions:
- 66% of employees preferred to receive the info directly with a person by phone
- 63% would most like to receive the info via a website/online portal, and
- 61% preferred an in-person conversation.
See the original article Here.
Source:
Bilski J. (2017 April 4). 5 benefits communication mistakes that kill employee satisfaction [Web blog post]. Retrieved from address https://www.hrmorning.com/5-benefits-communication-mistakes-that-kill-employee-satisfaction/
Just Say 'No' to Co-Workers' Halloween Candy
Originally posted on October 14, 2014 by Josh Cable on ehstoday.com.
Workplace leftovers might seem like one of the perks of the job. But when co-workers try to pawn off their Halloween candy on the rest of the department, it's more of a trick than a treat.
Those seemingly generous and thoughtful co-workers often are just trying to keep temptation out of their homes.
"Not only does candy play tricks on your waistline, but it also turns productive workers into zombies," says Emily Tuerk, M.D., adult internal medicine physician at the Loyola University Health System and assistant professor in the Department of Medicine at the Loyola University Chicago Stritch School of Medicine.
"A sugar high leads to a few minutes of initial alertness and provides a short burst of energy. But beware of the scary sugar crash. When the sugar high wears off, you'll feel tired, fatigued and hungry."
Tuerk offers a few tips to help you and others on your team avoid being haunted by leftover candy:
- Make a pact with your co-workers to not bring in leftover candy.
- Eat breakfast, so you don't come to work hungry.
- Bring in alternative healthy snacks, such as low-fat yogurt, small low-fat cheese sticks, carrot sticks or cucumber slices. Vegetables are a great healthy snack. You can't overdose on vegetables.
- Be festive without being unhealthy. Blackberries and cantaloupe are a fun way to celebrate with traditional orange and black fare without packing on the holiday pounds. Bring this to the office instead of candy as a creative and candy-free way to participate in the holiday fun.
- If you must bring in candy, put it in an out-of-the-way location. Don't put it in people's faces so they mindlessly eat it. An Eastern Illinois University study found that office workers ate an average of nine Hershey's Kisses per week when the candy was conveniently placed on top of the desk, but only six Kisses when placed in a desk drawer and three Kisses when placed 2 feet from the desk.
And if you decide to surrender to temptation and have a treat, limit yourself to a small, bite-size piece, Tuerk adds. Moderation is key.