

CenterStage...Open Season for Open Enrollment
In this month’s CenterStage, we interviewed Rich Arnold for some in-depth information on Medicare plans and health coverage. Read the full article below.

Open Season for Open Enrollment: What does it mean for you?
There are 10,000 people turning 65 every single day. Medicare has a lot of options, causing the process to be extremely confusing. Rich – a Senior Solutions Advisor – works hard to provide you with the various options available to seniors in Ohio, Kentucky and Indiana and reduce them to an ideal, simple, and easy-to-follow plan.
“For me, this is all about helping people.”
– Rich Arnold, Senior Solutions Advisor
What does this call for?
To provide clients with top-notch Medicare guidance, Rich must analyze their current doctors and drugs for the best plan option and properly educate them to choose the best program for their situation and health. It’s a simple, free process of evaluation, education, and enrollment.
For this month’s CenterStage article, we asked Rich to break down Medicare for the senior population who are in desperate need of a break from the confusion.
Medicare Break Down
Part A. Hospitalization, Skilled Nursing, etc.
If you’ve worked for 40 quarters, you automatically obtain Part A coverage.
Part B. Medical Services: Doctors, Surgeries, Outpatient visits, etc.…
You must enroll and pay a monthly premium.
Part C. Medicare Advantage Plans:
Provides most of your hospital and medical expenses.
Part D.
Prescription drug plans available with Medicare.
Under Parts A & B there are two types of plans…
Supplement Plan or Medigap Plan
A Medicare Supplement Insurance (Medigap) policy can help pay some of the health care costs that Original Medicare doesn’t cover, like copayments, coinsurance, and deductibles, coverage anywhere in the US as well as travel outside of the country, pay a monthly amount, and usually coupled with a prescription drug plan.
Advantage Plan
A type of Medicare health plan that contracts with Medicare to provide you with all your Part A and Part B benefits generally through a HMO or PPO, pay a monthly amount from $0 and up, covers emergency services, and offers prescription drug plans.
How does this effect you?
Medicare starts at 65 years of age, but Rich advises anyone turning 63 or 64 years of age to reach out to an advisor, such as himself, for zero cost, to be put onto their calendar to follow up at the proper time to investigate the Medicare options. Some confusion exists about Medicare and Social Security which are separate entities. Social Security does not pay for the Supplement or Advantage plans.
Medicare Open Enrollment: Open Enrollment occurs between October 15th and December 7 – yes, right around the corner! However, don’t panic, Rich and his services can help you if you are turning 65 or if you haven’t reviewed your current plan in over a year – you should seek his guidance.
Your plan needs to be reviewed every year to best fit your needs. If you’re on the verge of 65, turning 65 in the next few months, or over 65, you should consult your Medicare advisor as soon as possible. For a no cost analysis of your needs contact Rich, Saxon Senior Solutions Advisor, rarnold@gosaxon.com, 513-808-4879.

The Medicare Part D Prescription Drug Benefit
Below we have an article from the Kaiser Family Foundation providing detailed information and graphics on the benefit of the Medicare Prescription Drug Plan.
You can read the original article here.
Medicare Part D is a voluntary outpatient prescription drug benefit for people on Medicare that went into effect in 2006. All 59 million people on Medicare, including those ages 65 and older and those under age 65 with permanent disabilities, have access to the Part D drug benefit through private plans approved by the federal government; in 2017, more than 42 million Medicare beneficiaries are enrolled in Medicare Part D plans. During the Medicare Part D open enrollment period, which runs from October 15 to December 7 each year, beneficiaries can choose to enroll in either stand-alone prescription drug plans (PDPs) to supplement traditional Medicare or Medicare Advantage prescription drug (MA-PD) plans (mainly HMOs and PPOs) that cover all Medicare benefits including drugs. Beneficiaries with low incomes and modest assets are eligible for assistance with Part D plan premiums and cost sharing. This fact sheet provides an overview of the Medicare Part D program and information about 2018 plan offerings, based on data from the Centers for Medicare & Medicaid Services (CMS) and other sources.
Medicare Prescription Drug Plan Availability in 2018
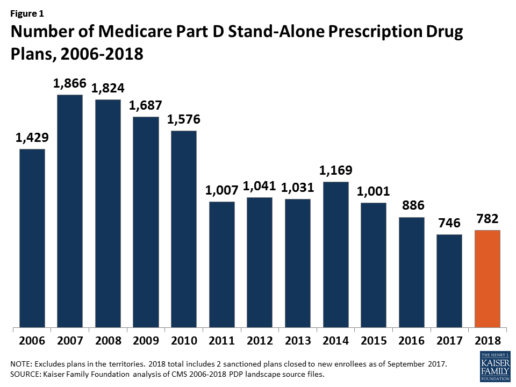
In 2018, 782 PDPs will be offered across the 34 PDP regions nationwide (excluding the territories). This represents an increase of 36 PDPs, or 5%, since 2017, but a reduction of 104 plans, or 12%, since 2016 (Figure 1).
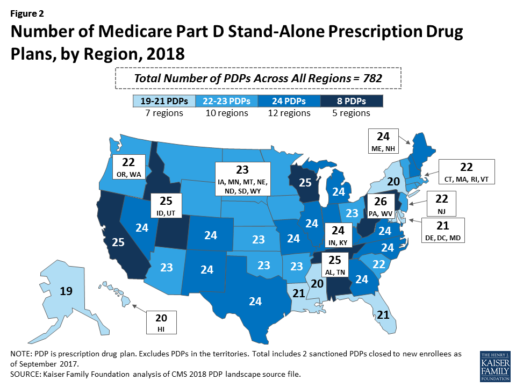
Beneficiaries in each state will continue to have a choice of multiple stand-alone PDPs in 2018, ranging from 19 PDPs in Alaska to 26 PDPs in Pennsylvania/West Virginia (in addition to multiple MA-PD plans offered at the local level) (Figure 2).
Low-Income Subsidy Plan Availability in 2018
Through the Part D Low-Income Subsidy (LIS) program, additional premium and cost-sharing assistance is available for Part D enrollees with low incomes (less than 150% of poverty, or $18,090 for individuals/$24,360 for married couples in 2017) and modest assets (less than $13,820 for individuals/$27,600 for couples in 2017).1
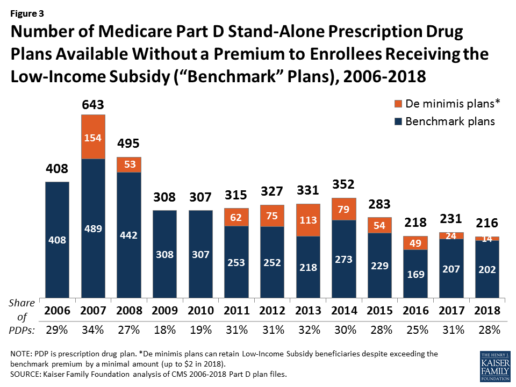
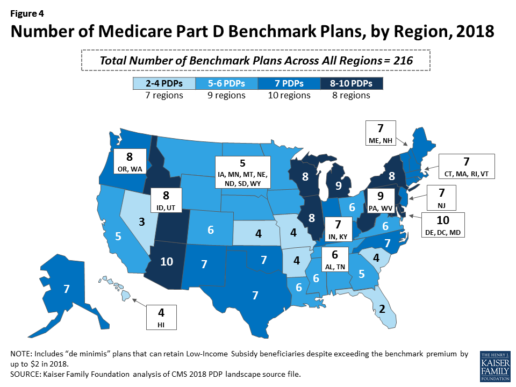
In 2018, 216 plans will be available for enrollment of LIS beneficiaries for no premium, a 6% decrease in premium-free (“benchmark”) plans from 2017 and the lowest number of benchmark plans available since the start of the Part D program in 2006. Roughly 3 in 10 PDPs in 2018 (28%) are benchmark plans (Figure 3).
Low-Income Subsidy Plan Availability in 2018
Through the Part D Low-Income Subsidy (LIS) program, additional premium and cost-sharing assistance is available for Part D enrollees with low incomes (less than 150% of poverty, or $18,090 for individuals/$24,360 for married couples in 2017) and modest assets (less than $13,820 for individuals/$27,600 for couples in 2017).1
In 2018, 216 plans will be available for enrollment of LIS beneficiaries for no premium, a 6% decrease in premium-free (“benchmark”) plans from 2017 and the lowest number of benchmark plans available since the start of the Part D program in 2006. Roughly 3 in 10 PDPs in 2018 (28%) are benchmark plans (Figure 3).
Benchmark plan availability varies at the Part D region level, with most regions seeing a reduction of 1 benchmark plan for 2018 (Figure 4). The number of premium-free plans in 2018 ranges from a low of 2 plans in Florida to 10 plans in Arizona and Delaware/Maryland/Washington D.C.
Part D Plan Premiums and Benefits in 2018
Premiums. According to CMS, the 2018 Part D base beneficiary premium is $35.02, a modest decline of 2% from 2017.2 Actual (unweighted) PDP monthly premiums for 2018 vary across plans and regions, ranging from a low of $12.60 for a PDP available in 12 out of 34 regions to a high of $197 for a PDP in Texas.
Part D enrollees with higher incomes ($85,000/individual; $170,000/couple) pay an income-related monthly premium surcharge, ranging from $13.00 to $74.80 in 2018 (depending on their income level), in addition to the monthly premium for their specific plan.3 According to CMS projections, an estimated 3.3 million Part D enrollees (7%) will pay income-related Part D premiums in 2018.
Benefits. In 2018, the Part D standard benefit has a $405 deductible and 25% coinsurance up to an initial coverage limit of $3,750 in total drug costs, followed by a coverage gap. During the gap, enrollees are responsible for a larger share of their total drug costs than in the initial coverage period, until their total out-of-pocket spending in 2018 reaches $5,000 (Figure 5).
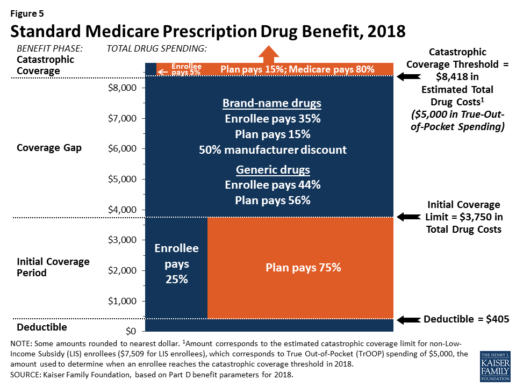
After enrollees reach the catastrophic coverage threshold, Medicare pays for most (80%) of their drug costs, plans pay 15%, and enrollees pay either 5% of total drug costs or $3.35/$8.35 for each generic and brand-name drug, respectively.
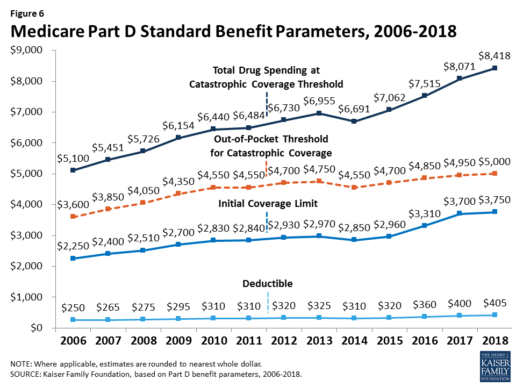
The standard benefit amounts are indexed to change annually by rate of Part D per capita spending growth, and, with the exception of 2014, have increased each year since 2006 (Figure 6).
Part D plans must offer either the defined standard benefit or an alternative equal in value (“actuarially equivalent”), and can also provide enhanced benefits. But plans can (and do) vary in terms of their specific benefit design, cost-sharing amounts, utilization management tools (i.e., prior authorization, quantity limits, and step therapy), and formularies (i.e., covered drugs). Plan formularies must include drug classes covering all disease states, and a minimum of two chemically distinct drugs in each class. Part D plans are required to cover all drugs in six so-called “protected” classes: immunosuppressants, antidepressants, antipsychotics, anticonvulsants, antiretrovirals, and antineoplastics.
In 2018, almost half (46%) of plans will offer basic Part D benefits (although no plans will offer the defined standard benefit), while 54% will offer enhanced benefits, similar to 2017. Most PDPs (63%) will charge a deductible, with 52% of all PDPs charging the full amount ($405). Most plans have shifted to charging tiered copayments or varying coinsurance amounts for covered drugs rather than a uniform 25% coinsurance rate, and a substantial majority of PDPs use specialty tiers for high-cost medications. Two-thirds of PDPs (65%) will not offer additional gap coverage in 2018 beyond what is required under the standard benefit. Additional gap coverage, when offered, has been typically limited to generic drugs only (not brands).
The 2010 Affordable Care Act gradually lowers out-of-pocket costs in the coverage gap by providing enrollees with a 50% manufacturer discount on the total cost of their brand-name drugs filled in the gap and additional plan payments for brands and generics. In 2018, Part D enrollees in plans with no additional gap coverage will pay 35% of the total cost of brands and 44% of the total cost of generics in the gap until they reach the catastrophic coverage threshold. Medicare will phase in additional subsidies for brands and generic drugs, ultimately reducing the beneficiary coinsurance rate in the gap to 25% by 2020.
Part D and Low-Income Subsidy Enrollment
Enrollment in Medicare drug plans is voluntary, with the exception of beneficiaries who are dually eligible for both Medicare and Medicaid and certain other low-income beneficiaries who are automatically enrolled in a PDP if they do not choose a plan on their own. Unless beneficiaries have drug coverage from another source that is at least as good as standard Part D coverage (“creditable coverage”), they face a penalty equal to 1% of the national average premium for each month they delay enrollment.
In 2017, more than 42 million Medicare beneficiaries are enrolled in Medicare Part D plans, including employer-only group plans.4 Of this total, 6 in 10 (60%) are enrolled in stand-alone PDPs and 4 in 10 (40%) are enrolled in Medicare Advantage drug plans. Medicare’s actuaries estimate that around 2 million other beneficiaries in 2017 have drug coverage through employer-sponsored retiree plans where the employer receives subsidies equal to 28% of drug expenses between $405 and $8,350 per retiree in 2018 (up from $400 and $8,250 in 2017).5 Several million beneficiaries are estimated to have other sources of drug coverage, including employer plans for active workers, FEHBP, TRICARE, and Veterans Affairs (VA). Yet an estimated 12% of Medicare beneficiaries lack creditable drug coverage.
Twelve million Part D enrollees are currently receiving the Low-Income Subsidy. Beneficiaries who are dually eligible, QMBs, SLMBs, QIs, and SSI-onlys automatically qualify for the additional assistance, and Medicare automatically enrolls them into PDPs with premiums at or below the regional average (the Low-Income Subsidy benchmark) if they do not choose a plan on their own. Other beneficiaries are subject to both an income and asset test and need to apply for the Low-Income Subsidy through either the Social Security Administration or Medicaid.
Part D Spending and Financing in 2018
The Congressional Budget Office (CBO) estimates that spending on Part D benefits will total $92 billion in 2018, representing 15.5% of net Medicare outlays in 2018 (net of offsetting receipts from premiums and state transfers). Part D spending depends on several factors, including the number of Part D enrollees, their health status and drug use, the number of enrollees receiving the Low-Income Subsidy, and plans’ ability to negotiate discounts (rebates) with drug companies and preferred pricing arrangements with pharmacies, and manage use (e.g., promoting use of generic drugs, prior authorization, step therapy, quantity limits, and mail order). Federal law prohibits the Secretary of Health and Human Services from interfering in drug price negotiations between Part D plan sponsors and drug manufacturers.6
Financing for Part D comes from general revenues (78%), beneficiary premiums (13%), and state contributions (9%). The monthly premium paid by enrollees is set to cover 25.5% of the cost of standard drug coverage. Medicare subsidizes the remaining 74.5%, based on bids submitted by plans for their expected benefit payments. Part D enrollees with higher incomes ($85,000/individual; $170,000/couple) pay a greater share of standard Part D costs, ranging from 35% to 80%, depending on income.
According to Medicare’s actuaries, in 2018, Part D plans are projected to receive average annual direct subsidy payments of $353 per enrollee overall and $2,353 for enrollees receiving the LIS; employers are expected to receive, on average, $623 for retirees in employer-subsidy plans.7 Part D plans’ potential total losses or gains are limited by risk-sharing arrangements with the federal government (“risk corridors”). Plans also receive additional risk-adjusted payments based on the health status of their enrollees and reinsurance payments for very high-cost enrollees.
Under reinsurance, Medicare subsidizes 80% of drug spending incurred by Part D enrollees above the catastrophic coverage threshold. In 2018, average reinsurance payments per enrollee are estimated to be $941; this represents a 7% increase from 2017. Medicare’s reinsurance payments to plans have represented a growing share of total Part D spending, increasing from 16% in 2007 to an estimated 41% in 2018.8 This is due in part to a growing number of Part D enrollees with spending above the catastrophic threshold, resulting from several factors, including the introduction of high-cost specialty drugs, increases in the cost of prescriptions, and a change made by the ACA to count the 50% manufacturer discount in enrollees’ out-of-pocket spending that qualifies them for catastrophic coverage. Analysis from MedPAC also suggests that in recent years, plans have underestimated their enrollees’ expected costs above the catastrophic coverage threshold, resulting in higher reinsurance payments from Medicare to plans over time.
Issues for the Future
After several years of relatively low growth in prescription drug spending, spending has risen more steeply since 2013. The average annual rate of growth in Part D costs per beneficiary was 2.4% between 2007 and 2013, but it increased to 4.4% between 2013 and 2016, and is projected to increase by 4.7% between 2016 and 2026
(Figure 7).9
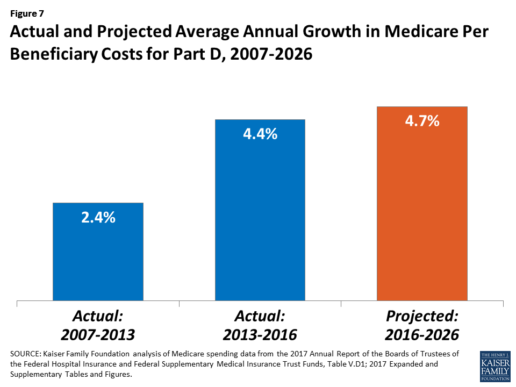
Medicare’s actuaries have projected that the Part D per capita growth rate will be comparatively higher in the coming years than in the program’s initial years due to higher costs associated with expensive specialty drugs, which is expected to be reflected in higher reinsurance payments to plans. Between 2017 and 2027, spending on Part D benefits is projected to increase from 15.9% to 17.5% of total Medicare spending (net of offsetting receipts).10 Understanding whether and to what extent private plans are able to negotiate price discounts and rebates will be an important part of ongoing efforts to assess how well plans are able to contain rising drug costs. However, drug-specific rebate information is not disclosed by CMS.
The Medicare drug benefit helps to reduce out-of-pocket drug spending for enrollees, which is especially important to those with modest incomes or very high drug costs. Closing the coverage gap by 2020 will bring additional relief to millions of enrollees with high costs. But with drug spending on the rise and more plans charging coinsurance rather than flat copayments for covered brand-name drugs, enrollees could face higher out-of-pocket costs for their Part D coverage. These trends highlight the importance of comparing plans during the annual enrollment period. Research shows, however, that relatively few people on Medicare have used the annual opportunity to switch Part D plans voluntarily—even though those who do switch often lower their out-of-pocket costs as a result of changing plans.
Understanding how well Part D is working and how well it is meeting the needs of people on Medicare will be informed by ongoing monitoring of the Part D plan marketplace and plan enrollment; assessing coverage and costs for high-cost biologics and other specialty drugs; exploring the relationship between Part D spending and spending on other Medicare-covered services; and evaluating the impact of the drug benefit on Medicare beneficiaries’ out-of-pocket spending and health outcomes.
Endnotes
- Poverty and resource levels for 2018 are not yet available (as of September 2017).
- The base beneficiary premium is equal to the product of the beneficiary premium percentage and the national average monthly bid amount (which is an enrollment-weighted average of bids submitted by both PDPs and MA-PD plans). Centers for Medicare & Medicaid Services, “Annual Release of Part D National Average Bid Amount and Other Part C & D Bid Information,” July 31, 2017, available at https://www.cms.gov/Medicare/Health-Plans/MedicareAdvtgSpecRateStats/Downloads/PartDandMABenchmarks2018.pdf.
- Higher-income Part D enrollees also pay higher monthly Part B premiums.
- Centers for Medicare & Medicaid Services, Medicare Advantage, Cost, PACE, Demo, and Prescription Drug Plan Contract Report – Monthly Summary Report (Data as of August 2017).
- Board of Trustees, 2017 Annual Report of the Boards of Trustees of the Federal Hospital Insurance and Federal Supplementary Medical Insurance Trust Funds, Table IV.B7, available at https://www.cms.gov/Research-Statistics-Data-and-Systems/Statistics-Trends-and-Reports/ReportsTrustFunds/Downloads/TR2017.pdf.
- Social Security Act, Section 1860D-11(i).
- 2017 Annual Report of the Boards of Trustees of the Federal Hospital Insurance and Federal Supplementary Medical Insurance Trust Funds; Table IV.B9.
- Kaiser Family Foundation analysis of aggregate Part D reimbursement amounts from Table IV.B10, 2017 Annual Report of the Boards of Trustees of the Federal Hospital Insurance and Federal Supplementary Medical Insurance Trust Funds.
- Kaiser Family Foundation analysis of Part D average per beneficiary costs from Table V.D1, 2017 Annual Report of the Boards of Trustees of the Federal Hospital Insurance and Federal Supplementary Medical Insurance Trust Funds.
- Kaiser Family Foundation analysis of Part D benefits spending as a share of net Medicare outlays (total mandatory and discretionary outlays minus offsetting receipts) from CBO, Medicare-Congressional Budget Office’s June 2017 Baseline.
Read the full article here.
Source:
Kaiser Family Foundation (2 October 2017). “The Medicare Part D Prescription Drug Benefit” [Web Blog Post]. Retrieved from address https://www.kff.org/medicare/fact-sheet/the-medicare-prescription-drug-benefit-fact-sheet/#26740

15 Most Expensive States for Long-Term Care: 2017
Are you reaching retirement? Then, perhaps, you've already looked into the affordability of long-term care, and - well - it's not as affordable as you thought. If you're looking to get the most out of your retirement budget, then you may want to stray away from these 15 most expensive states for long-term care, as of 2017.
This article is brought to you by Think Advisor, and it was written by Marlene Y. Satter. You can read the full article here.
Genworth’s annual study on the cost of care nationwide, which includes home care, assisted living facilities, etc., is not reassuring

The price of long-term care insurance is high—for everyone involved. Not just the patient but also the caregivers pay in more than money to make sure that the person in need of care is given the best care they can manage.
In this year’s version of Genworth Financial’s annual study on the cost of care nationwide—not just in nursing homes, which are less and less on the forefront, but also care provided at home, adult day care and assisted living facilities—the news is not reassuring. Costs have risen steadily, with those for licensed homemakers—those who provide what the study calls “hands-on personal care” for patients still in their homes—rising the fastest, increasing 6.17% just since last year.
And of course since people would prefer to stay in their homes, that’s going to hit a lot of people hard.
Less-skilled “homemaker care,” such as cooking, cleaning and running errands (not included in the breakdown that follows) has risen pretty quickly as well, increasing by 4.75% since last year. But both versions of homemaker assistance are at the low end on the price scale, coming in at $21 for homemaker care and $22 for licensed homemaker care. The big bucks are elsewhere.
They may not have risen as quickly percentage-wise as the two already mentioned, but adult day care increased by 2.94% since last year to a national median rate of $70 per day. Assisted living facilities now average a median monthly rate of $3,750, an increase of 3.36% from last year, while nursing homes, at an increase of 5.50% for a private room, now run a median daily rate of $267. No matter how you look at it, that’s a lot of money.
And caregivers often sacrifice their own financial well-being to care for their family members, forking over an average of $10,000 out of their own pockets for expenses that range from household expenses, personal items, or transportation services to payment of informal caregivers or LTC facilities.
A whopping 62% are paying for these expenses out of their own retirement funds; 45% have seen those costs cut their basic quality of living; and 38% have cut the amount they devote to savings and retirement to meet the costs of care.
And another sad side effect of all this stress is that 27% say it’s had a negative impact on their relationship with the person they’re caring for.
The penalty for all this devotion is that absences, reduced hours and chronic tardiness can end up cutting a caregiver’s pay. About a half of caregivers estimate that they lost approximately a third of their income.
Check out the 15 most expensive states for LTC.

15. Maryland
Average Annual LTC Cost: $60,305
- Adult day care: $2,150
- Licensed home care: $52,281
- Assisted living: $49,800
- Nursing home (private room): $118,990

14. Rhode Island
Average Annual LTC Cost: $60,789
- Adult day care: $19,500
- Licensed home care: $57,772
- Assisted living: $61,860
- Nursing home (private room): $104,025

13. California
Average Annual LTC Cost: $61,239
- Adult day care: $20,020
- Licensed home care: $57,200
- Assisted living: $51,300
- Nursing home (private room): $116,435
")
12. Washington
Average Annual LTC Cost: $61,704
- Adult day care: $16,900
- Licensed home care: $60,632
- Assisted living: $55,920
- Nursing home (private room): $113,362
")
11. Vermont
Average Annual LTC Cost: $63,139
- Adult day care: $34,320
- Licensed home care: $57,200
- Assisted living: $49,527
- Nursing home (private room): $111,508
")
10. North Dakota
Average Annual LTC Cost: $64,010
- Adult day care: $25,480
- Licensed home care: $63,972
- Assisted living: $36,219
- Nursing home (private room): $130,367

9. Maine
Average Annual LTC Cost: $64,423
- Adult day care: $28,080
- Licensed home care: $53,768
- Assisted living: $58,680
- Nursing home (private room): $117,165

8. New York
Average Annual LTC Cost: $65,852
- Adult day care: $20,800
- Licensed home care: $54,340
- Assisted living: $47,850
- Nursing home (private room): $140,416
")
7. New Hampshire
Average Annual LTC Cost: $66,044
- Adult day care: $18,720
- Licensed home care: $60,357
- Assisted living: $58,260
- Nursing home (private room): $126,838

6. Delaware
Average Annual LTC Cost: $68,472
- Adult day care: $18,850
- Licensed home care: $50,908
- Assisted living: $72,180
- Nursing home (private room): $131,948

5. New Jersey
Average Annual LTC Cost: $68,833
- Adult day care: $23,400
- Licensed home care: $52,624
- Assisted living: $69,732
- Nursing home (private room): $129,575

4. Hawaii
Average Annual LTC Cost: $71,820
- Adult day care: $18,200
- Licensed home care: $59,488
- Assisted living: $51,000
- Nursing home (private room): $158,593
")
3. Connecticut
Average Annual LTC Cost: $72,671
- Adult day care: $20,800
- Licensed home care: $52,624
- Assisted living: $55,200
- Nursing home (private room): $162,060
![]()
2. Massachusetts
Average Annual LTC Cost: $73,307
- Adult day care: $16,900
- Licensed home care: $59,488
- Assisted living: $67,188
- Nursing home (private room): $149,650
")
1. Alaska
Average Annual LTC Cost: $117,800
- Adult day care: $43,709
- Licensed home care: $63,492
- Assisted living: $72,000
- Nursing home (private room): $292,000
You can read the full article here.
Source:
Satter M. (2 October 2017). "15 Most Expensive States for Long-Term Care: 2017" [Web Blog Post]. Retrieved from address https://www.thinkadvisor.com/2017/10/02/15-most-expensive-states-for-long-term-care-2017

Apple, Fitbit to join FDA program to speed health tech
Wondering how technology can speed the process of developing health tech? In this article from BenefitsPro written by Anna Edney, gain a close insight on how Apple and Fitbit are working together with the FDA to make your health of vital importance.
You can read the original article here.
A federal agency that regulates apples wants to make regulations on Apple Inc. a little easier.
The Food and Drug Administration, which oversees new drugs, medical devices and much of the U.S. food supply, said Tuesday that it had selected nine major tech companies for a pilot program that may let them avoid some regulations that have tied up developers working on health software and products.
“We need to modernize our regulatory framework so that it matches the kind of innovation we’re being asked to evaluate,” FDA Commissioner Scott Gottlieb said in a statement.
The program is meant to let the companies get products pre-cleared rather than going through the agency’s standard application and approval process that can take months. Along with Apple, Fitbit Inc., Samsung Electronics Co., Verily Life Sciences, Johnson & Johnson and Roche Holding AG will participate.
A new report and video from the Health Enhancement Research Organization (HERO) identifies six promising practices for effectively integrating wearables...
The FDA program is meant to help the companies more rapidly develop new products while maintaining some government oversight of technology that may be used by patients or their doctors to prevent, diagnose and treat conditions.
Apple is studying whether its watch can detect heart abnormalities. The process it will go through to make sure it’s using sound quality metrics and other measures won’t be as costly and time-consuming as when the government clears a new pacemaker, for example. Verily, the life sciences arm of Google parent Alphabet Inc., is working with Novartis AG to develop a contact lens that could continuously monitor the body’s blood sugar.
Faster Pace
“Historically, health care has been slow to implement disruptive technology tools that have transformed other areas of commerce and daily life,” Gottlieb said in July when he announced that digital health manufacturers could apply for the pilot program.
Officially dubbed the Pre-Cert for Software Pilot, Gottlieb at the time called it “a new and pragmatic approach to digital health technology.”
The other companies included in the pilot are Pear Therapeutics Inc., Phosphorus Inc. and Tidepool.
The program is part of a broader move at the FDA, particularly since Gottlieb took over in May, to streamline regulation and get medical products to patients faster. The commissioner said last week the agency will clarify how drugmakers might use data from treatments already approved in some disease to gain approvals for more conditions. In July, he delayed oversight of electronic cigarettes while the agency decides what information it will need from makers of the products.
Rules Uncertainty
As Silicon Valley developers have pushed into health care, the industry has been at times uncertain about when it needed the FDA’s approval. In 2013, the consumer gene-testing company 23andMe Inc. was ordered by the agency to temporarily stop selling its health analysis product until it was cleared by regulators, for example.
Under the pilot, the FDA will scrutinize digital health companies’ software and will inspect their facilities to ensure they meet quality standards and can adequately track their products once they’re on the market. If they pass the agency’s audits, the companies would be pre-certified and may face a less stringent approval process or not have to go through FDA approval at all.
More than 100 companies were interested in the pilot, according to the FDA. The agency plans to hold a public workshop on the program in January to help developers not in the pilot understand the process and four months of initial findings.
You can read the original article here.
Source:
Edeny A. (27 September 2017). "Apple, Fitbit to join FDA program to speed health tech" [Web Blog Post]. Retrieved from address https://www.benefitspro.com/2017/09/27/apple-fitbit-to-join-fda-program-to-speed-health-t
Absent federal action, states take the lead on curbing drug costs
What's your state's stance on the cost of prescription drugs? See how Maryland has moved forward in their decision making for drug prices, giving themselves the ability to say "no" in this article from Benefits Pro written by Shefali Luthra.
You can read the original article here.
Lawmakers in Maryland are daring to legislate where their federal counterparts have not: As of Oct. 1, the state will be able to say “no” to some pharmaceutical price spikes.
A new law, which focuses on generic and off-patent drugs, empowers the state’s attorney general to step in if a drug’s price climbs 50 percent or more in a single year. The company must justify the hike. If the attorney general still finds the increase unwarranted, he or she can file suit in state court. Manufacturers face a fine of up to $10,000 for price gouging.
As Congress stalls on what voters say is a top health concern — high pharmaceutical costs — states increasingly are tackling the issue. Despite often-fierce industry opposition, a variety of bills are working their way through state governments. California, Nevada and New York are among those joining Maryland in passing legislation meant to undercut skyrocketing drug prices.
Maryland, though, is the first to penalize drugmakers for price hikes. Its law passed May 26 without the governor’s signature.
The state-level momentum raises the possibility that — as happened with hot-button issues such as gay marriage and smoke-free buildings — a patchwork of bills across the country could pave the way for more comprehensive national action. States feel the squeeze of these steep price tags in Medicaid and state employee benefit programs, and that applies pressure to find solutions.
“There is a noticeable uptick among state legislatures and state governments in terms of what kind of role states can play in addressing the cost of prescription drugs and access,” said Richard Cauchi, health program director at the National Conference of State Legislatures.
Many experts frame Maryland’s law as a test case that could help define what powers states have and what limits they face in doing battle with the pharmaceutical industry.
The generic-drug industry has already filed a lawsuit to block the law, arguing it’s unconstitutionally vague and an overreach of state powers. A district court is expected to rule soon.
The state-level actions focus on a variety of tactics:
“Transparency bills” would require pharmaceutical companies to detail a drug’s production and advertising costs when they raise prices over certain thresholds. Cost-limit measures would cap drug prices charged by drugmakers to Medicaid or other state-run programs, or limit what the state will pay for drugs. Supply-chain restrictions include regulating the roles of pharmacy benefit managers or limiting a consumer’s out-of-pocket costs.
A New York law on the books since spring allows officials to cap what its Medicaid program will pay for medications. If companies don’t sufficiently discount a drug, a state review will assess whether the price is out of step with medical value.
Maryland’s measure goes further — treating price gouging as a civil offense and taking alleged violators to court.
“It’s a really innovative approach. States are looking at how to replicate it, and how to expand on it,” said Ellen Albritton, a senior policy analyst at the left-leaning Families USA, which has consulted with states including Maryland on such policies.
Lawmakers have introduced similar legislation in states such as Massachusetts, Rhode Island, Tennessee and Montana. And in Ohio voters are weighing a ballot initiative in November that would limit what the state pays for prescription drugs in its Medicaid program and other state health plans.
Meanwhile, the California legislature passed a bill earlier in September that would require drugmakers to disclose when they are about to raise a price more than 16 percent over two years and justify the hike. It awaits Democratic Gov. Jerry Brown’s signature.
In June, Nevada lawmakers approved a law similar to California’s but limited to insulin prices. Vermont passed a transparency law in 2016 that would scrutinize up to 15 drugs for which the state spends “significant health care dollars” and prices had climbed by set amounts in recent years.
But states face a steep uphill climb in passing pricing legislation given the deep-pocketed pharmaceutical industry, which can finance strong opposition, whether through lobbying, legal action or advertising campaigns.
Last fall, voters rejected a California initiative that would have capped what the state pays for drugs — much like the Ohio measure under consideration. Industry groups spent more than $100 million to defeat it, putting it among California’s all-time most expensive ballot fights. Ohio’s measure is attracting similar heat, with drug companies outspending opponents about 5-to-1.
States also face policy challenges and limits to their statutory authority, which is why several have focused their efforts on specific parts of the drug-pricing pipeline.
Critics see these tailored initiatives as falling short or opening other loopholes. Requiring companies to report prices past a certain threshold, for example, might encourage them to consistently set prices just below that level.
Maryland’s law is noteworthy because it includes a fine for drugmakers if price increases are deemed excessive — though in the industry that $10,000 fine is likely nominal, suggested Rachel Sachs, an associate law professor at Washington University in St. Louis who researches drug regulations.
This law also doesn’t address the trickier policy question: a drug’s initial price tag, noted Rena Conti, an assistant professor in the University of Chicago who studies pharmaceutical economics.
And its focus on generics means that branded drugs, such as Mylan’s Epi-Pen or Kaleo’s overdose-reversing Evzio, wouldn’t be affected.
Yet there’s a good reason for this, noted Jeremy Greene, a professor of medicine and the history of medicine at Johns Hopkins University who is in favor of Maryland’s law.
Current interpretation of federal patent law suggests that the issues related to the development and affordability of on-patent drugs are under federal jurisdiction, outside the purview of states, he explained.
In Maryland, “the law was drafted narrowly to address specifically a problem we’ve only become aware of in recent years,” he said. That’s the high cost of older, off-patent drugs that face little market competition. “Here’s where the state of Maryland is trying to do something,” he said.
Still, a ruling against the state in the pending court case could have a chilling effect for other states, Sachs said, although it would be unlikely to quash their efforts.
“This is continuing to be a topic of discussion, and a problem for consumers,” said Sachs.
“At some point, some of these laws are going to go into effect — or the federal government is going to do something,” she added.
Kaiser Health News, a nonprofit health newsroom whose stories appear in news outlets nationwide, is an editorially independent part of the Kaiser Family Foundation. KHN’s coverage of prescription drug development, costs and pricing is supported in part by the Laura and John Arnold Foundation.
Source:
Luther S. (29 September 2017). "Absent federal action, states take the lead on curbing drug costs" [Web Blog Post]. Retrieved from address https://www.benefitspro.com/2017/09/29/absent-federal-action-states-take-the-lead-on-curb?page=2

Employers Broadening Health Programs
Employers are starting to change their approach on how they look at their employee benefits program. Take a look at this great article by Nick Otto from Employee Benefit Adviser and find out how employers are reclassifying their employee benefits program in order to expand their employees' well-being.
The siloed approach to retirement, healthcare and wellness is a thing of the past as employers are increasingly taking a holistic approach to addressing their employees’ health and wealth.
Employers are expanding their view of employee overall well-being, according to a new report from Optum, a technology-enabled health services company. That means that, while employers are still offering traditional wellness programs, there has been a significant shift in the last three years to those programs addressing workers’ financial, behavioral and social health.
“For example, we see increased interest among companies in developing new programs around mindfulness, positivity and creativity, which can reduce stress, improve eating and sleeping habits, and stimulate innovative thinking,” says Seth Serxner, Optum’s chief health officer.
While physical health still remains a significant focus for employee wellness programs, other dimensions are tracking with higher importance among large employers:
· 51% of such programs now address financial health, up from 38% in 2015;
· 47% address employees’ social health by using strategies like team-based activities to increase feelings of connectedness and a sense of belonging, compared to 37% in 2015; and
· 68% address behavioral health, up from 65% in 2015
And technology is helping employers to better engage these programs to workers. Since 2014, there has been a significant increase in the use of a variety of innovations, including online competitions, activity tracking devices, social networks, mobile apps and mobile messaging to help engage employees, the study notes.
Additionally, incentive strategies are helping to get workers in the wellness game.
Use of incentives is at an all-time high, Optum notes, with 95% of employer respondents offering incentives to their employees. Recognizing that workers can be highly influenced by their family members, 74% of employers also are offering incentives to family members. According to Optum, average incentives per participant per year equate to $532.
See the original article Here.
Source:
Otto N. (2017 August 15). Employers broadening health programs [Web blog post]. Retrieved from address https://www.employeebenefitadviser.com/news/employers-broadening-health-programs

How Health Coaching can Revitalize a Workforce
Do you need help revitalizing your workforce? Check out this great column by Paul Turner from Employee Benefit Advisor and see how health coaching can be a great way to increase engagement and productivity among your employees.
Nearly 50% of Americans live with at least one chronic illness, and millions more have lifestyle habits that increase their risk of health problems in the future, according to the Centers for Disease Control and Prevention. Type 2 diabetes, cardiovascular disease, cancer, pulmonary disease and other conditions account for more than 75% of the $2 trillion spent annually on medical care in the U.S.
Employers have a stake in improving on these discouraging statistics. People spend a good portion of their lives at work, where good health habits can be cultivated and then integrated into their personal lives. While chronic diseases often can’t be cured, many risk factors can be mitigated with good health behaviors, positive and consistent lifestyle habits and adherence to medication and treatment plans. Moreover, healthy behaviors — like smoking cessation, weight management, and exercise — can help prevent people from developing a chronic disease in the first place.
Companies that sponsor well-being programs realize the benefits of a healthier and more vital employee population, with lower rates of absenteeism and improved productivity. Investing in such programs can yield a significant return — particularly from condition management programs for costly chronic diseases.
Digitally-based well-being programs in particular are powerful motivators to adopt healthy behaviors. Yet for many employees, dealing with difficult health challenges can be daunting and digital wellness tools may not offer them sufficient support. Combining these health technologies with the skill and support of a health coach, however, can be a winning approach for greater workplace well-being. The benefits of coaching can also extend to employees that are currently healthy. People without a known condition may still struggle with stress, sleep issues, and lack of exercise, and the guidance of a coach can address risk factors and help prevent future health problems.
Choosing a health coach
Coaching is an investment, and the more rigor that employers put into the selection of a coaching team, the better the results. Coaches should be a credentialed Certified Health Education Specialist or a healthcare professional, such as a registered nurse or dietician, who is extensively trained in motivational interviewing. It also helps when a coach has a specialty accreditation in an area such as nutrition, exercise physiology, mental health or diabetes management. Such training allows the coach to respond effectively to highly individualized needs.
This sort of personalization is essential. A good coach will recognize that each wellness program participant is motivated by a different set of desires and rewards and is undermined by their own unique combination of doubts, fears and temptations. They build trust and confidence by helping employees identify the emotional triggers that may lead them to overeat, smoke or fail to stick with their treatment plans and healthy lifestyle behaviors.
What works for one employee, does not work for another. A 50-year-old trying to quit smoking may need the personal touch of a meeting or phone conversation to connect with her coach; a 30-year-old focused on stress management might prefer email or texting. It’s important for the coaching team to accommodate these preferences.
Working with our employer clients, WebMD has seen what rigorous coaching can achieve:
· A 54% quit rate for participants in a 12-week smoking-cessation program
· Successful weight loss for 68% of those who joined a weight-management program
· A nearly 33% reduction in known health risks for relatively healthy employees in a lifestyle coaching program
· A corresponding 28% health risk reduction for employees with a known condition who received condition management coaching.
Coaching is more likely to succeed when it is part of a comprehensive wellness program carried out in an environment where employee well-being is clearly emphasized by the employer and its managers. WebMD popularizes the saying that ‘When the coach is in, everybody wins.’ Qualified health coaching may be the missing ingredient that helps an employer achieve its well-being goals and energize its workforce.
See the original article Here.
Source:
Turner P. (2017 July 27). How health coaching can revitalize a workforce [Web blog post]. Retrieved from address https://www.employeebenefitadviser.com/opinion/how-health-coaching-can-revitalize-a-workforce?feed=00000152-1387-d1cc-a5fa-7fffaf8f0000
Employee financial health connects to physical health
Did you know that there is a direct corelation between financial and physical health? This article from Benefits Pro is a great read explaining the link between an employee's financial and physical health by Caroline Marwitz
LAS VEGAS -- Are poor physical health and poor financial health connected? The benefits industry is making the link, if you consider how many deals between health-related benefits companies and retirement providers have occurred lately.
Obviously, the poor, at least in America, have a more fragile state of health than the more affluent. And as we age, the potential for unplanned health events to hurt us financially increases -- and that's important for retirement advisors and plan sponsors to remember. But what about your typical employees who are neither poor nor elderly?
A study in the journal Psychological Science looked at worker attitudes and actions to find out whether poor physical health and poor financial health might be linked, and how.
The researchers studied employees who were given an employer-sponsored health exam and were told they needed to change certain behaviors to improve their health. Which employees made the changes and who blew them off?
The researchers accounted for external factors such as different levels of income and physical health, and differences in demographics. Yet the results were still startling:
“Employees who saved for the future by contributing to a 401(k) showed improvements in their abnormal blood-test results and health behaviors approximately 27% more often than noncontributors did,” the researchers concluded in Healthy, Wealthy, and Wise: Retirement Planning Predicts Employee Health Improvements.
The employees who made the behavior changes to better their physical health were also the ones who were taking action to better their financial health.
Employee attitudes about the future and how much control they have over it affect whether they take care of their physical health and their financial health. That sense of control, or conversely, that feeling of no control, and thus, no investment in long-term results, is one reason why some employees might not participate in retirement plans, and, maybe, wellness and well-being programs.
What if, along with the retirement health-care cost calculators many retirement plan providers offer, there was a fatalism calculator too? That way you could see right away each person’s sense of control or feelings of inevitability about their future and help them more efficiently.
Because if someone is more fatalistic, telling them about their 401(k) match or pension options isn’t going to make them enroll in a retirement plan. Scaring them with statistics about the high costs of health care in retirement isn’t going to do the trick either. Instead, consider the following points for such employees:
- They can be helped to see that the future is a lot more unpredictable (and complex) than they realize, both negatively and positively.
- They can be helped to realize that even the smallest actions they undertake can have a big impact in the long term.
- They can be helped to understand that seemingly unobtainable goals can be broken down into steps and tackled bit by bit.
Look behind employee behavior for the unexamined biases and long-held assumptions that are causing it. If they can see that it’s not who they are that determines their future but what they do, it's a start.
See the original article Here.
Source:
Marwitz C. (2017 March 19). Employee financial health connects to physical health [Web blog post]. Retrieved from address https://www.benefitspro.com/2017/03/19/employee-financial-health-connects-to-physical-hea?ref=hp-top-stories
Get The Best of Both Worlds
OSMA's Health Benefits Plan: Frequently Asked Questions & Answers
In response to the changes brought about by the Affordable Care Act (ACA), the Ohio State Medical Association (OSMA) plans to offer a Health Benefits Plan (HBP). The OSMA HBP will be a self-funded multiple employer welfare arrangement developed for Ohio physician practices. The HBP is currently pending approval by the Ohio Department of Insurance. If approved, it would be an innovative alternative to the ACA.
Q. How is the OSMA's HPB different from the ACA?
A. Unlike the current ACAstructure, the OSMA HBP
• Will be a self funded plan for small physician practices.
• Will offer a variety of plan designs that meet the minimum essential coverage requirement, including:
• Eight different options with deductibles ranging from $ 500 to $6,350 for single coverage (2x for family
coverage)
• Several plans with copays and prescription drug cards
• Will allow for the continued use of Health Reimbursement Accounts (HRA) and Health Saving Accounts (HSA).
• May be less expensive than many comparable options under the ACA.
• Will allow for changes in benefits and contribution roles al renewal without being "locked in" by the grandfathered status, and no monthly administrative billing fee.
Q. Will my current plan rates go up under the ACA?
A. The ACA premium will be dependent on a variety of factors and specific to each group. Our in-house insurance agent will help you understand your options and will be in a position to help you get the most affordable benefit option available.
Q. Do I have to switch doctors?
A. The OSMA HBP utilizes the SuperMed Plus network from Medical Mutual of Ohio, one of the largest networks of providers and facilities in the state. You should, however, always check to make sure your doctor is in network prior to any service. (https://providersearch.medmutual.com/NetworkRealignment.aspx)
Q. Does the OSMA HBP provide the employer with a Summary Plan Description (SPD)?
A. Yes. We provide each employer with an SPDfor the OSMA HBP that meets ERISA compliance regulations. (All employers are responsible for providing SPD's for all of their health and welfare benefits.)
Q. What is the cost to me for joining the OSMA HBP?
A. Each group will have a monthly funding rate based on a variety of factors including but not limited to:
• Number of CoveredEmployees
• Medical History
• Gender
• Tobacco Usage
• Location
Q. Why should I change plans now?
A. Due to the constant policy evolution of the ACA and the uncertainty of future year premiums, many groups will be able to experience a competitive rate that may not be available from Ohio's ACA Marketplace. The OSMA Insurance Agency will provide an easy to understand comparison between the ACA plans and the HBP.
Q. If I leave my current plan (including an ACA plan) will I be subject to preexisting conditions limitations?
A. No. The coverage will be offered on a guarantee issue basis with no preexisting condition exclusion.
Q. What happens if I decide to leave the OSMA HBP in the future?
A. Members may elect to withdraw from participation in the Plan at the end of a calendar month by giving written notice to the Plan at least thirty (30) days prior to the end of such month.
Q.Is there a fee to be part of the OSMA HB Plan?
A. No. There is no fee to join the OSMA Health Benefit Plan but at least one insured must be an active member of the Ohio State Medical Association.
Q. Is the OSMA HBP permitted by the ACA?
A. Yes. The OSMA HBP is a self-fund ed option allowed under the ACA. The OSMA Insurance Agency is authorized to offer health insurance plans as a Federally-facilitated Marketplace Certified agent and Certified Patient Protection and Affordable Care Act (PPACA) Professional.
Q. What is the OSMA Health Benefit Plan's legal structure?
A. The OSMA HBP is technically known as a multiple employer welfare arrangement (MEWA). A MEWA provides health and welfare benefits to employees of two or more employers who pool their contributions, enabling them to offer health insurance rates and benefits typically available only to larger groups.
Q. How secure is the OSMA's HBP?
A. The Ohio Department of Insurance and several federal government agencies coordinate the oversight and regulation of the OSMA HBP. This multi-jurisdiction gives the State of Ohio's Department of Insurance primary responsibility for overseeing the financial soundness the OSMA HBP, while the U.S. Department of Labor provides oversight for employee benefit plans and the Internal Revenue Service ensures the nonprofit tax status of the OSMA HBP.
Q. Is there a situation when my practice should use the ACA's marketplace options?
A. The Ohio Department of Insurance and several federal government agencies coordinate the oversight and regulation of the OSMA HBP. This multi-jurisdiction gives the State of Ohio's Department of Insurance primary responsibility for overseeing the financial soundness the OSMA HBP, while the U.S. Department of Labor provides oversight for employee benefit plans and the Internal Revenue Service ensures the nonprofit tax status of the OSMA HBP.
Q. How do I learn more about the OSMA Health Benefit Plan?
A. Contact Saxon' s Expert at jcharlton@gosaxon.com or visit our website at https://gosaxon.com/get-the-best-of-both-worlds-with-osma/
For the full download click Here.